Nosocomial pneumonia (NP) is the most common infectious complication in the intensive care unit (ICU) [1]. NP accounts for 25% of all infectious complications in the ICU, and more than half of all prescribed antibiotics are used for its treatment [2]. The frequency of ventilator-associated pneumonia (VAP) reaches 86% of all cases of postoperative pneumonia in surgical patients [3]. Delay of diagnosis and administration of the correct starting antimicrobial therapy for VAP significantly increases the duration of hospital stay and mortality [4]. According to some data, the incidence of VAP in neurosurgical patients reaches 40-50% [5]. Neurosurgical and neurological patients often require prolonged mechanical ventilation (MV), and, therefore, the problem of respiratory complications is especially relevant among such patients [6]. Usually, patients undergoing elective neurosurgical interventions, as well as patients with acute cerebrovascular accidents (ACVA), do not exhibit signs of respiratory infection before the transfer to mechanical ventilation. The development of VAP, therefore, is a consequence of mechanical ventilation, while the transfer to MV requires readiness to treat associated infections [7].
The emergence of an infectious process in the lungs during hospitalization should be considered as a result of an imbalance between the factors of anti-infectious protection and factors associated with the underlying disease and its treatment, contributing to the entry of potentially pathogenic microorganisms into the respiratory tract. Thus, the development of nosocomial pneumonia is associated with pathogenic microflora overcoming the antimicrobial defense mechanisms. The state of the immune response can be assessed by the change in the concentration of cytokines released at different stages of pneumonia [8].
According to the European guidelines for the treatment of NP and VAP, published in 2017, biomarkers that can be used to assess the course of pneumonia include C-reactive protein (CRP), procalcitonin, copeptin (a protein fragment of the prohormone vasopressin), and the mid-regional proatrial natriuretic peptide (MP-proANP). At the same time, research results indicate the low specificity and predictive value of these markers. In this regard, it is not recommended to routinely measure biomarkers to predict the outcome of the disease or the effectiveness of therapy on the 3-4 day of VAP [9]. In addition, the correlation between concentrations of known mediators of inflammation, markers of endotoxicosis, or specific biomarkers can significantly vary at the serum, tissue and cell levels [27]. Despite this, many studies indicate that cytokines may be promising as predictors of the severity of both community and nosocomial pneumonia [28].
Considering the above, the identification of potential biomarkers of effectiveness of antibiotic therapy in VAP is a relevant task.
Purpose of the study: to investigate changes the plasma cytokine profile in neuroresuscitation patients with VAP and to determine potential markers of antibiotic therapy effectiveness.
Our two-center observational study was conducted at the Federal Center of Treatment and Rehabilitation and the Pirogov City Clinical Hospital in Moscow, Russia. The study of biological material was carried out at the N.F. Gamaleya Institute of Epidemiology and Microbiology, Moscow, Russia. 73 patients were included in the study (40 men and 33 women), from 19 to 82 years of age, according to the inclusion and exclusion criteria.
The inclusion criteria were:
The exclusion criteria from the study were:
The observation period for each patient was 5 days. The first day of the study was the day of antibiotic administration when signs of VAP were detected. On days 1 and 3, all patients underwent blood sampling to determine the concentration of cytokines, the levels of leukocytes, CRP, and body temperature. On the first day, the blood samples were taken before the administration of antibacterial drugs. Plasma obtained after centrifugation of blood samples was placed in tubes with protease inhibitors (SIGMAFAST ™ Protease Inhibitor Tablets, Category No. S8820, containing 4-(2-Aminoethyl)benzenesulfonyl fluoride hydrochloride, Ethylenediaminetetraacetic acid, bestatin, N-(trans-Epoxysuccinyl)-L-leucine 4-guanidinobutylamide, leupeptin and aprotinin) and frozen at -70 ° C. The clinical state of the patients was recorded for 5 days, the criteria for dividing patients into groups were applied retrospectively.
All patients included in the study received antibiotic therapy in accordance with the sensitivity of local nosocomial flora of the intensive care unit. Respiratory support was carried out within the concept of protective ventilation: pressure-controlled ventilation modes, tidal volume - 6-8 ml/kg, positive end-expiratory pressure - 8-12 cm H2O.
Investigation of the differences in the hospital microbiological landscape, as well as the range of prescribed antibiotics was not included in the objectives of this study. In addition, the study did not take into account the differences in treatment tactics of underlying diseases, fluid resuscitation and enteral nutrition between the groups.
Retrospectively, patients were divided into two groups (conventionally designated as "white" and "red") depending on the clinical course of the disease. The "white" group included patients, whose condition improved after starting antibiotic therapy or replacing antibiotic therapy during the study period (successful antibiotic therapy, N = 36). The "red" group included patients whose condition did not change or worsened, despite the ongoing antimicrobial therapy (N = 37), the CPIS score was more than 5 points by the 5th day of observation.
Allocation to the "white" group was determined by an expert assessment of the patients’ clinical condition and the results of laboratory tests:
To measure cytokine and chemokine concentrations in plasma we used Bio-Plex 27-plex and 37-plex kits (Bio-Rad, USA), measurements were performed using the Bio-Plex® MAGPIX ™ multiplex analysis system (Bio-Rad, USA). A multiplex enzyme immunoassay of plasma samples was performed on Magpix magnetic particles (Bio-Rad, USA). We determined the concentrations of 59 cytokines: interleukin-1 receptor antagonist (IL-1ra), interleukin-1 beta, interleukin-2, interleukin-4, interleukin-5, interleukin-6 (IL-6), interleukin-7, interleukin-8, interleukin-9, interleukin -10, interleukin-12 (IL-12), interleukin-13, interleukin-15, interleukin-17, Interferon gamma-inducible protein-10, eotaxin, granulocyte colony stimulating factor (G-CSF), colony-stimulating factor of granulocytes and macrophages, interferon gamma, monocytic chemotactic protein-1, macrophage inflammatory protein 1-alpha, macrophage inflammatory protein 1-beta, basic fibroblast growth factor, platelet growth factor (PDGF-BB), vascular endothelial growth factor, chemokine expressed and secreted by T cells upon activation (RANTES), tumor necrosis factor alpha, a member of the tumor necrosis factor 13 ligand superfamily (APRIL or TNFSF13), B-lymphocyte activating factor (BAFF), cell membrane protein from the tumor necrosis factor receptor family (sCD30), soluble hemoglobin receptor expressed on the cell membrane of macrophages (sCD163), chitinase 3-like protein 1 (Chitinase 3-like), glycoprotein 130 (gp130 / sIL-6Rb), interferon alpha-2, interferon beta, interleukin-6 alpha receptor, interleukin-11, interleukin-12p40, interleukin-19, interleukin-20, interleukin-22, interleukin-26, interleukin- 27p28, interleukin-28A (IL-28A / IFN-lambda2), interleukin-29 (IL-29 / IFN-lambda1), interleukin-32, interleukin-34, interleukin-35, protein of the tumor necrosis factor superfamily 14 (LIGHT or TNFSF14 ), matrix metalloproteinase 1, matrix metalloproteinase 2 (MMP-2), matrix metalloproteinase 3, osteocalcin, osteopontin, pentraxin-3, soluble tumor necrosis factor receptor 1, soluble tumor necrosis factor receptor 2, thymic stromal lymphopoietin (TSLP), weak inductor of apoptosis, associated with tumor necrosis factor (TWEAK). Sample preparation and analysis were performed according to the method of the manufacturer. Calculation of the cytokine concentration was performed using the device software.
Statistical data processing was carried out using the PASW Statistics 22 program. The samples were examined for normality using the Shapiro-Wilks test. Descriptive statistics for quantitative variables are presented as mean, median, and 25th and 75th percentiles, outliers calculated from the exclusive median. To compare quantitative data in two unrelated samples, we used Student's t-test for parameters distributed normally, and Mann-Whitney U-test for parameters whose distribution was different from normal. The nonparametric Wilcoxon test was used to compare quantitative data in two related populations. The significance level (p) was taken equal to 0.05 in all comparisons.
To assess the prognostic significance of the absolute value of cytokine concentrations and their changes within 3 days, ROC analysis (Receiver Operator Characteristic) was used. Indicators with high values of sensitivity / specificity and statistical significance were selected and thresholds for diagnostic criteria were determined. The overall predictive value of the markers was assessed by the area under the curve (AUC). The absolute values and changes in cytokine concentration were used to build a predictive model. The multivariate predictive model was constructed using the logistic regression method with stepwise elimination of variables according to Wald's algorithm.
The study was approved by the Interuniversity Ethics Committee, Protocol No. 03-15 dated 03.19.2015.
We selected 73 patients who met the criteria for inclusion in the study. The demographic characteristics of the patients are presented in Table 1.
Table 1. Descriptive characteristics of the clinical groups
| Characteristic | All patients N = 73 |
«White» group N = 36 |
«Red» group N = 37 |
|---|---|---|---|
| Age, years | 54.8 ± 17.2 | 55.8 ± 17.2 | 53.8 ± 17.3 |
| Sex | |||
| Men | 55% (40) | 61.1% (22) | 48.6% (18) |
| Women | 45% (33) | 38.9% (14) | 51.4% (19) |
| Main diagnosis (damage or disease of the central nervous system) | |||
| Hemorrhagic stroke | 21.9% (16) | 22.2% (8) | 21.6% (8) |
| Ischemic stroke | 13.7% (10) | 16.7% (6) | 10.8% (4) |
| Postresuscitation | 9.6% (7) | 2.8% (1) | 16.2% (6) |
| Brain tumor | 19.2% (14) | 19.4% (7) | 18.9% (7) |
| Brain arterial aneurysm | 6.8% (5) | 11.1% (4) | 2.7% (1) |
| Closed head injury | 15.1% (11) | 8.3% (3) | 21.6% (8) |
| Open head injury | 6.8% (5) | 8.3% (3) | 5.4% (2) |
| Others | 6.8% (5) | 11.1% (4) | 2.7% (1) |
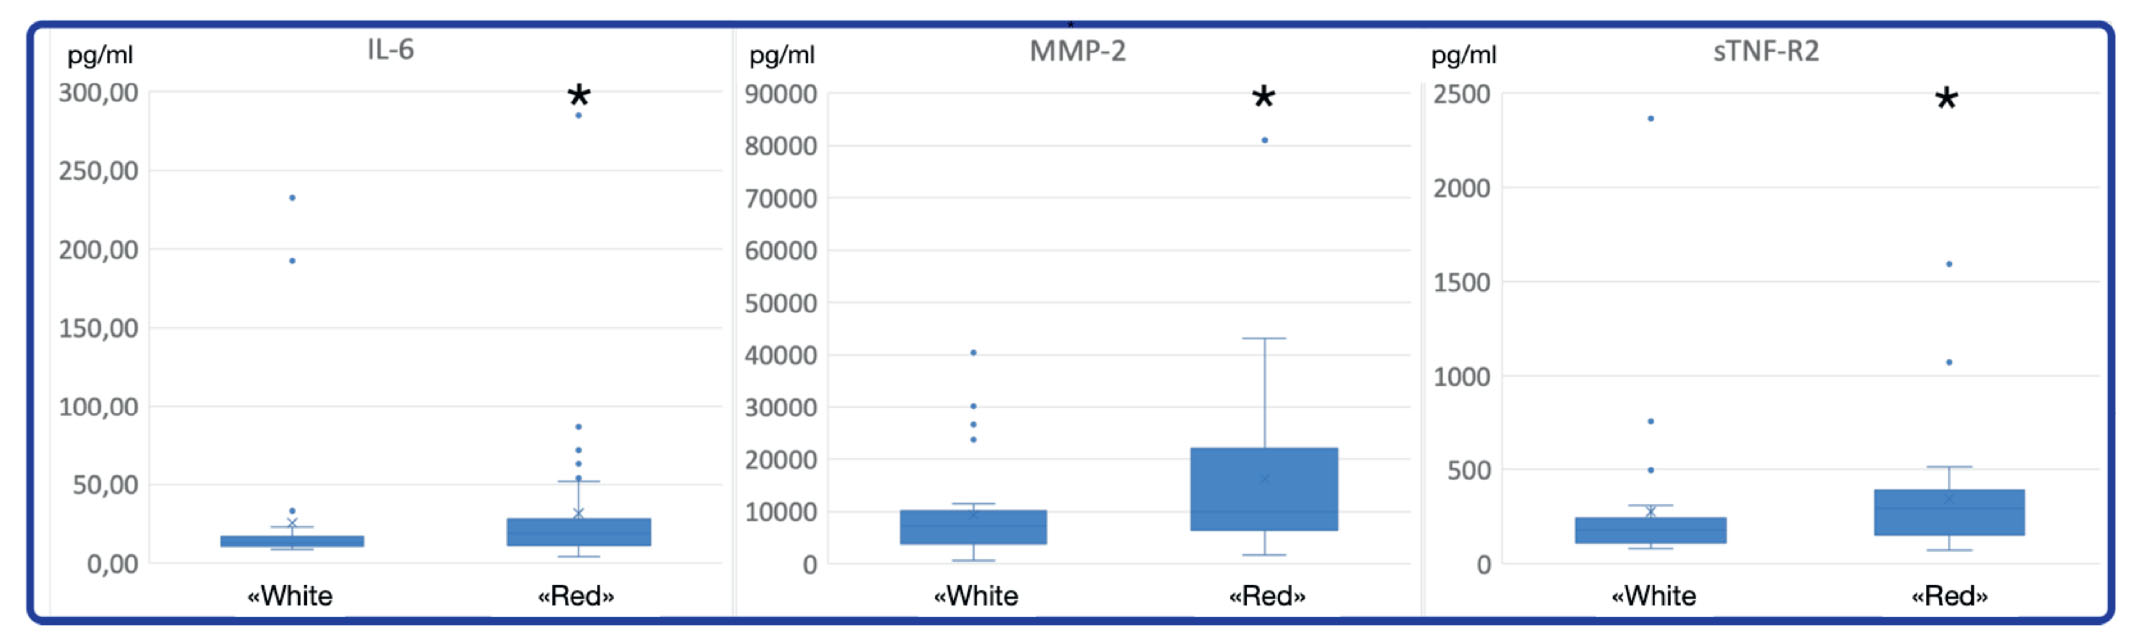
To assess changes in the immune status of patients with different responses to treatment, a comparison was made of cytokine concentrations on the 1st and 3rd days within the groups, as well as between groups on the 1st day of the study. The presence of objective differences in the clinical state of the patients between the "red" and "white" groups confirms the significantly different level of leukocytosis on the 1st day and significant differences in body temperature on the 3rd day. In terms of the absolute value of cytokine concentration on the 3rd day, statistically significant differences between the groups were not detected. On day 1, the plasma concentrations of IL-6, MMP-2 and sTNF-R2 significantly differed between the “red” and “white” groups (Mann-Whitney test, p <0.05, Figure 1).
Fig. 1. Statistically significant differences in concentration of cytokines IL-6, MMP-2, sTNF-R2 between patient group with favorable clinical course of VAP (“white group”) and patient group with unfavorable clinical course of VAP (“red group”) on day 1. Stars mark statistically significant higher levels of cytokine concentration (p<0,05, Mann–Whitney U-test)
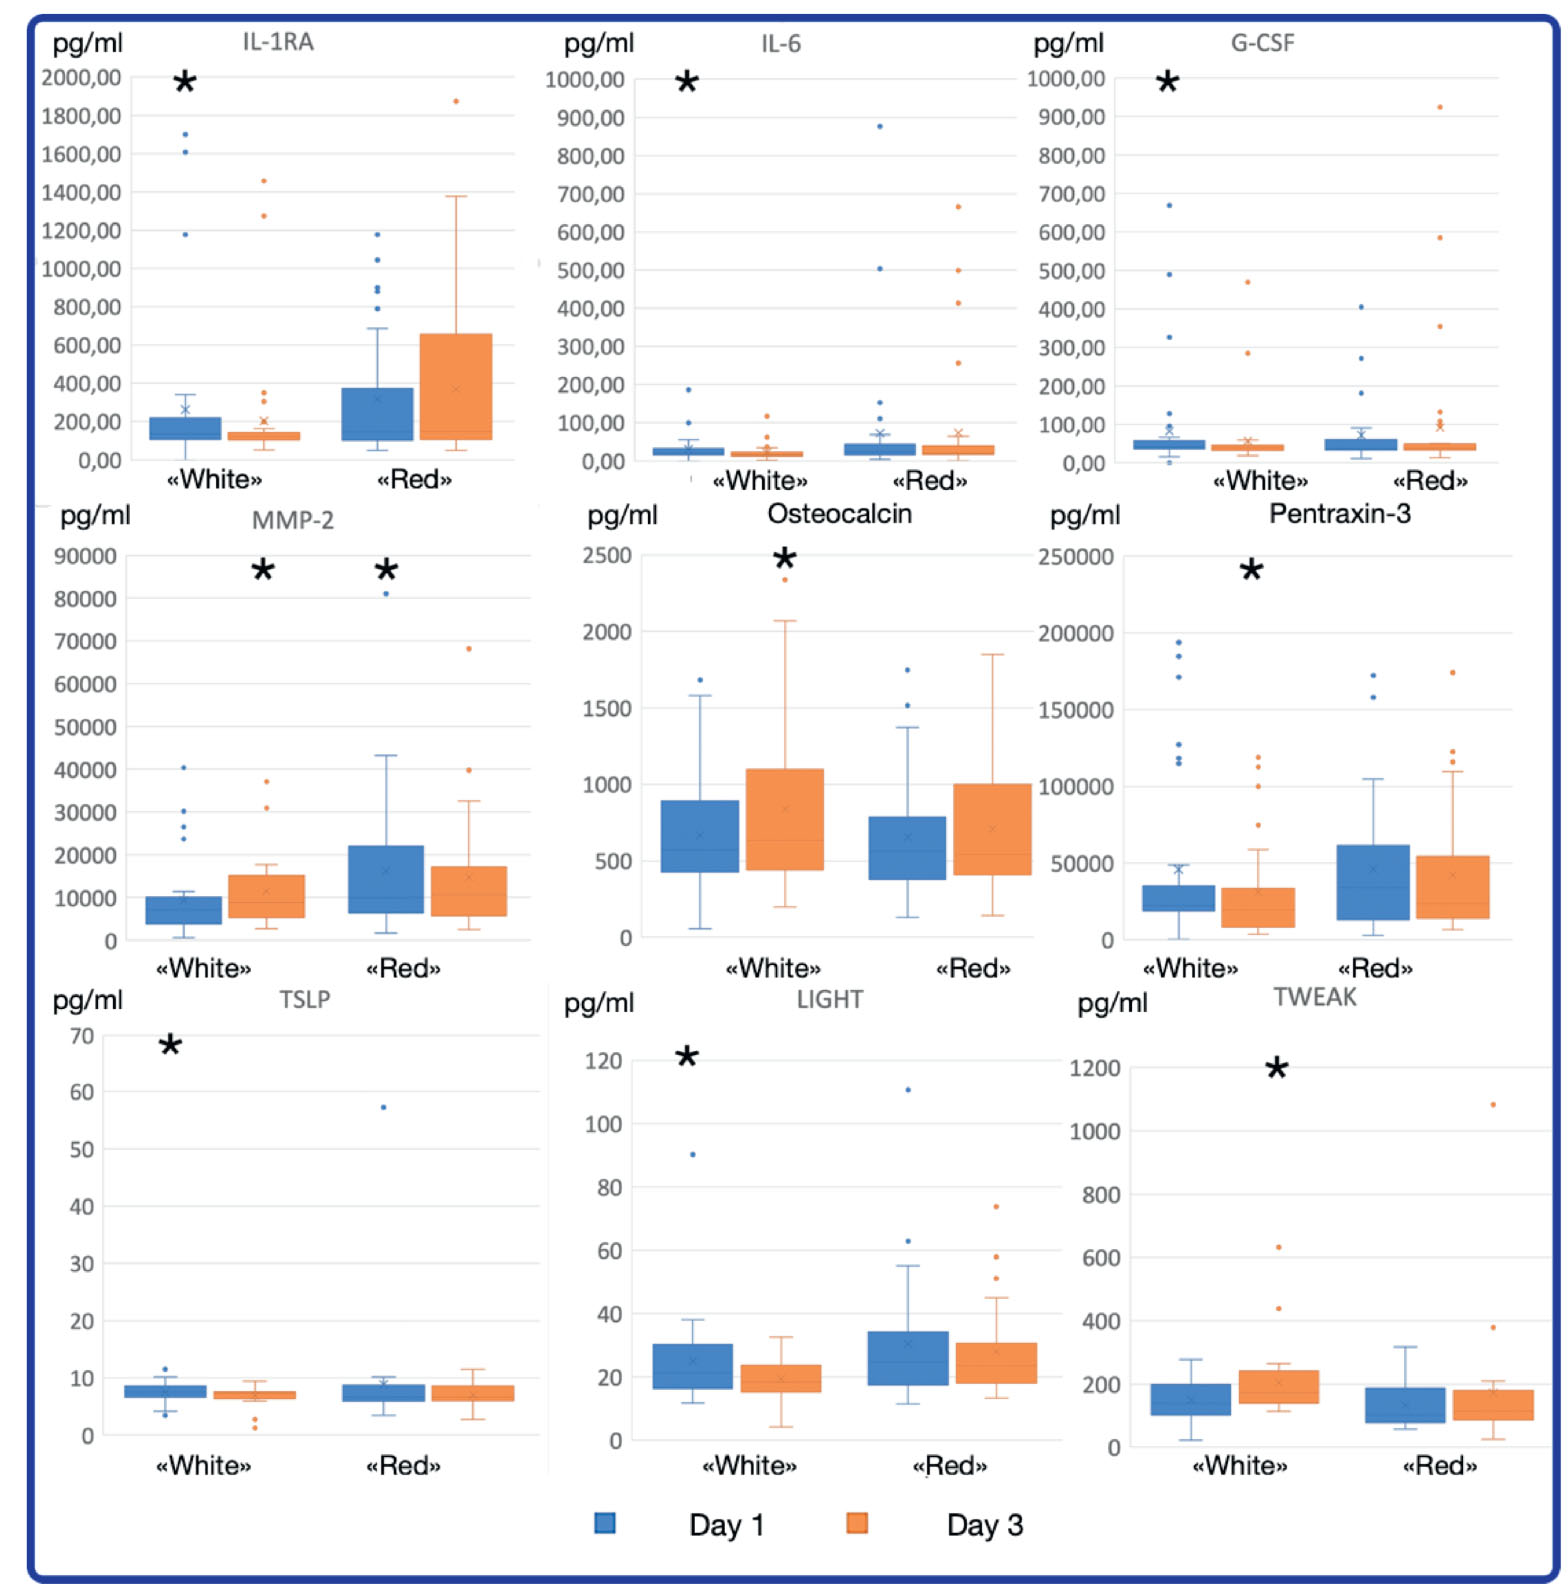
Further, the dynamics of cytokine concentration between the first and third days within each group was investigated. The Wilcoxon test of significant ranks (p <0.05) revealed statistically significant differences. In the “white” group, on day 3, the concentrations of cytokines MMP-2, osteocalcin and TWEAK significantly increased and the concentrations of IL-1ra, IL-6, G-CSF, LIGHT, pentraxin, TSLP decreased (Figure 2).
Fig. 2. Statistically significant changes in cytokine concentration in the “white group”. Stars mark the time point (day) with statistically higher cytokine concentration in this group in comparison with the second time point (day) (р<0,05 Wilcoxon signed-rank test). Blue – day 1, orange – day 3.
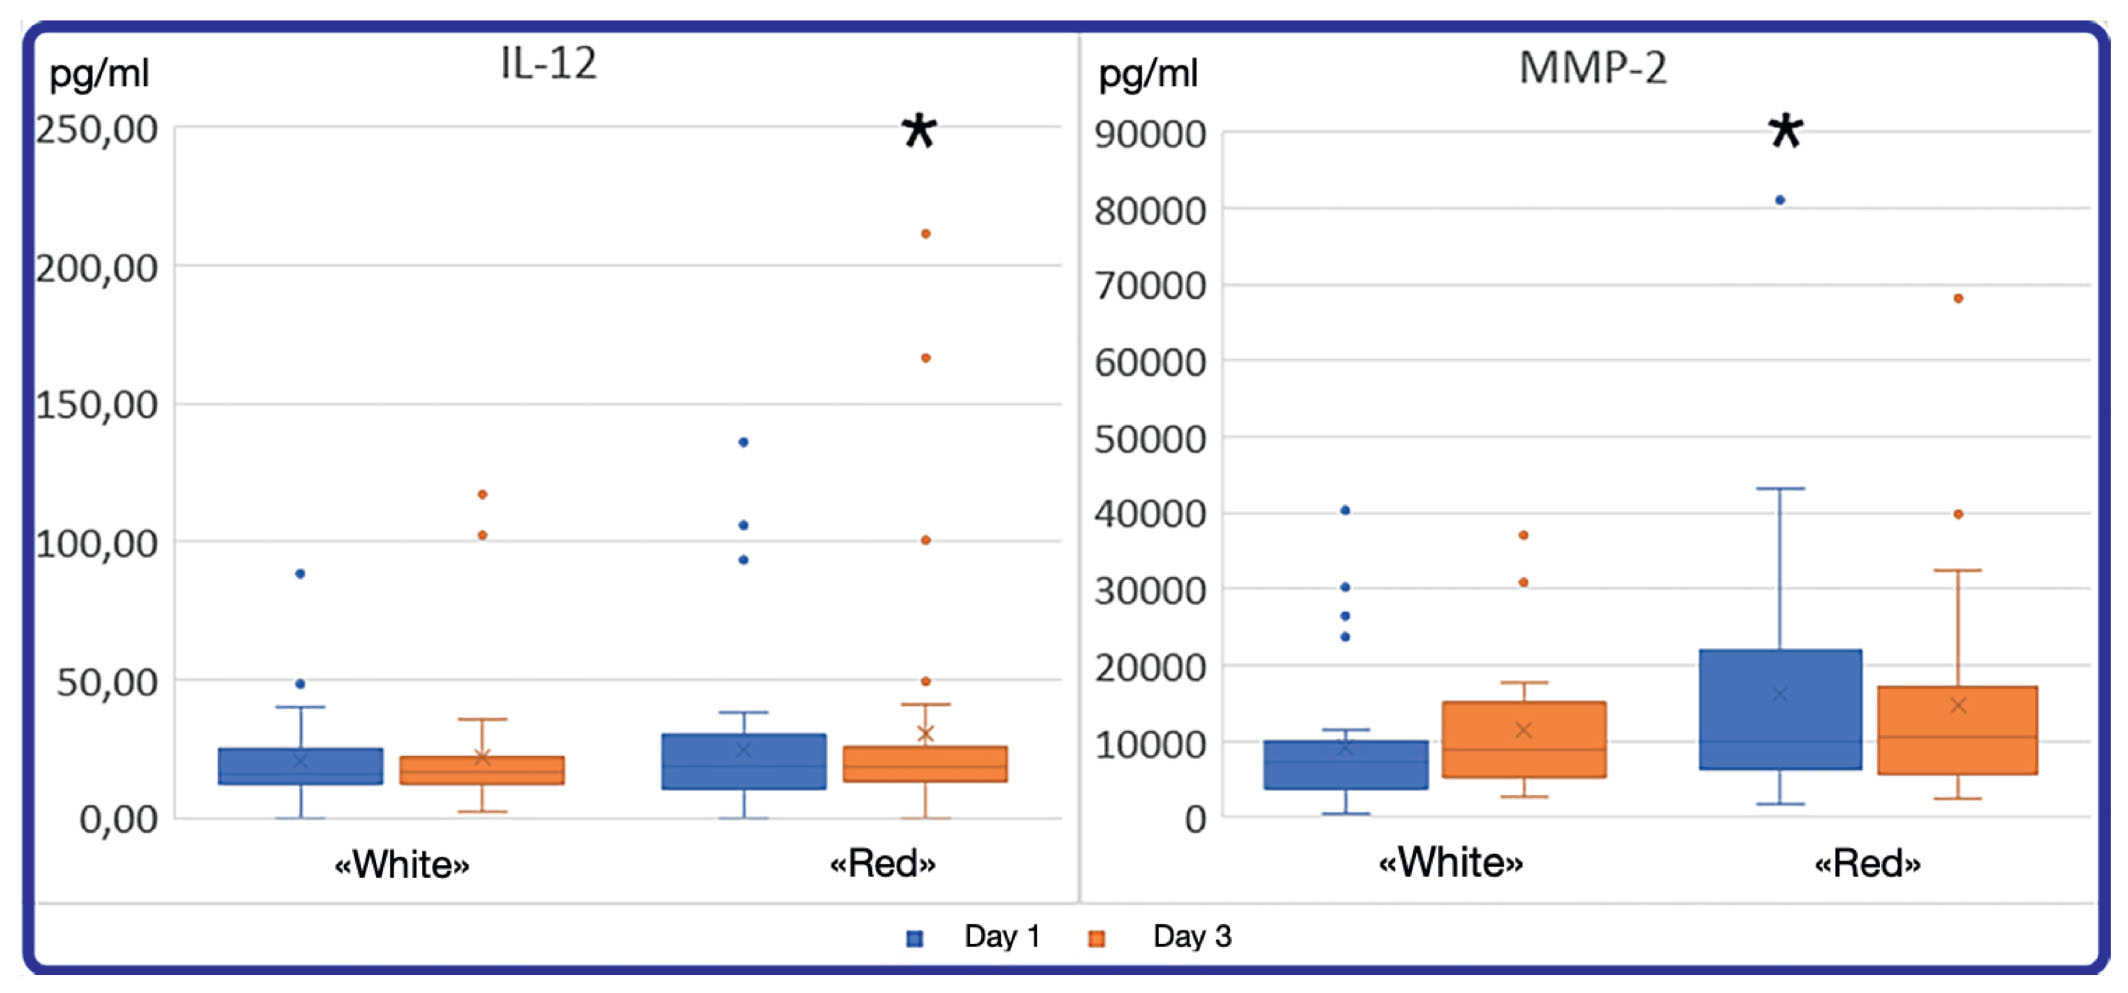
In the "red" group, by day 3 the concentration of MMP-2 significantly decreased and the concentration of IL-12 increased (Figure 3).
Fig. 3. Statistically significant changes in cytokine concentration in the “red group”. Stars mark the time point (day) with statistically higher cytokine concentration in this group in comparison with the second time point (day) (р<0,05 Wilcoxon signed-rank test).
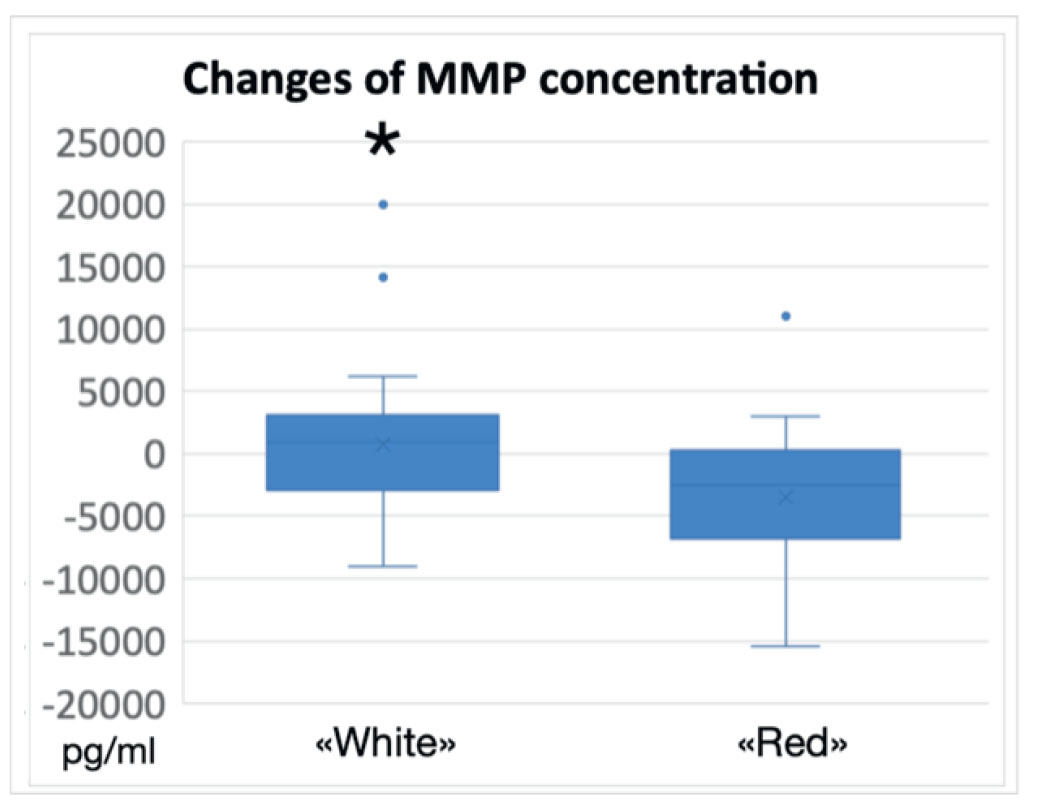
Despite the presence of statistically significant dynamics in cytokine concentration, on average, the difference between the absolute values on the first and third days did not exceed 50 pg/ml. Due to the considerable scatter of data and small sample sizes, the change in the concentration of most cytokines did not differ significantly between the “red” and “white” groups. Only the dynamics of MMP-2 concentration differed significantly between the groups (p <0.05, Mann-Whitney test). In the “white” group the average increase in the concentration of MMP-2 was 1265.25 pg/ml, in the “red” group the average decrease was -2118.90 pg/ml (Figure 4).
Fig 4. Change in average concentration of MMP-2 on day 3 in comparison with day 1 in the “red” and “white” groups. The difference is statistically significant (p<0,05, Mann–Whitney U-test).
ROC analysis of significant predictors of favorable outcome
To assess the predictive value of the dynamics of cytokines, the concentration of which changed significantly, ROC analysis was performed. Sensitivity and specificity values at various cut-off points were used to construct ROC curves, the overall marker efficacy was assessed using the area under the curve (AUC). The results with confidence intervals (CI) are presented in Table 2.
Table 2. AUC for significant predictors of clinical outcome
|
Cytokine |
AUC |
95% CI lower |
95% CI upper |
Significance |
|---|---|---|---|---|
|
IL-1RA |
0.642 |
0.510 |
0.775 |
0.038 |
|
G-CSF |
0.643 |
0.515 |
0.772 |
0.037 |
|
IL-10 |
0.677 |
0.526 |
0.828 |
0.029 |
|
LIGHT |
0.686 |
0.534 |
0.838 |
0.022 |
|
MMP-2 |
0.768 |
0.636 |
0.900 |
0.001 |
|
TWEAK |
0.680 |
0.530 |
0.830 |
0.026 |
MMP-2 has a significantly higher predictive power compared to other cytokines. AUC values below 0.7 indicate a low value of other cytokines as predictors of VAP outcome, therefore MMP-2 was chosen for further research. Figure 5 shows the ROC-curve of changes in the concentration of this cytokine as a criterion for the outcome of VAP. With the chosen threshold value of -659.0 picograms, the sensitivity and specificity were 82.1% and 70.8%, respectively.
Fig. 5. ROC-curve for the change of MMP-2 concentration between day 1 and day 3 as a predictor of treatment outcome of VAP. Green line- reference line, blue line – ROC-curve

In order to further study the predictive markers of the clinical course of VAP, we built a predictive model based on the logistic regression method. Using stepwise inclusion of variables, cytokines that did not increase prediction accuracy were eliminated. The model was built on the basis of changes in the concentration of MMP-2. Based on the constructed model, it can be concluded that the dynamics of MMP-2 can be a predictor of allocation into the “white” or “red” group with an accuracy of 69.2% (p = 0.013).
Among all cytokines, according to the results using classical methods of statistics, ROC-analysis and the logistic regression model, the concentration of MMP-2 turned out to be the most sensitive predictor of the clinical course of VAP. An increase in MMP-2 concentration can predict or indicate a favorable course of VAP and successful antibiotic therapy, a decrease - a high risk of an unfavorable clinical course.
Literature data indicate a relationship between the patient's immune status and the clinical course of VAP [10,11]. The clinical response to treatment is largely determined by the interaction between the pathogen and components of the immune system. The activity of one or another component of the immune system is manifested by the release of cytokines necessary for the recruitment and phenotyping of certain leukocytes. Since the lung tissue is abundantly supplied with blood, an increase in the concentration of cytokines can be expected when they are released in the focus of inflammation [12]. We investigated a wide range of cytokines by enzyme immunoassay on the first and third days after the start of patient observation. Of the 59 investigated cytokines, only a few had a significantly different concentration between the groups or between the 1st and 3rd days. It can be assumed that the production of most cytokines is stable regardless of the course of the disease, or that their release in the inflammation focus does not cause a transfer into the bloodstream.
The most promising cytokine, according to the results of this study, turned out to be matrix metalloproteinase-2, the main substrates of which are type 4 collagen and elastin - components of the basal lamina. MMP-2 is involved in tissue remodeling and modulation of inflammation. Studies have shown changes in the plasma concentration of MMP-2 in severe sepsis, reflecting the degree of organ dysfunction [13, 14]. We did not find literature data on the value of MMP-2 as a marker of the effectiveness of antibiotic therapy and the severity of the clinical course of VAP. J-S. Hong et al., in an experimental study, showed that matrix metalloproteinases 2 and 9 are necessary for an adequate immune response in pneumonia caused by a typical pathogen Streptococcus pneumoniae. The production of MMP-2 is important for the phagocytosis of bacteria by macrophages and the release of active forms of oxygen by neutrophils [15]. I. Puljiz et al. studied the concentration of MMP-2 in community-acquired pneumonia caused by Mycoplasma pneumoniae. The authors found that the plasma levels of MMP-2 in patients with community-acquired pneumonia is higher at the convalescence stage and lower in the acute phase of the disease, compared to patients in the control group [16]. A study by H. Bircan et al. showed that the concentration of MMP-2 was higher in patients with community-acquired pneumonia and correlated with a worse prognosis of treatment [17]. This is fully consistent with the results obtained in our study: the concentration of MMP-2 was significantly higher on the 1st day in the high-risk (“red”) group compared with the low-risk (“white”) group, but on the 3rd day it significantly decreased. Based on the logistic regression method, we built a predictive model to assess the predictive ability of MMP-2 dynamics as a marker for determining the clinical response to therapy. With an accuracy of about 70%, the dynamics of MMP-2 made it possible to predict a favorable or unfavorable clinical course of the disease. The significance of MMP-2 was also confirmed by classical statistical tests and ROC analysis. MMP-2 has an ambivalent role as a necessary component of the immune response and an effector of autodamage [18]. The results obtained confirm that both a high initial concentration of MMP-2 and its decrease in dynamics indicate a severe course of pneumonia. Based on the data obtained, it can be assumed that MMP-2 can serve as a marker of the effectiveness of antibiotic therapy in VAP, however, to clarify the results, further studies and larger group sizes are required.
A number of cytokines turned out to be weak predictors of the severity of the course of VAP, but statistically significant differences between their concentrations in the “white” and “red” groups on the 1st and 3rd days of observation indicate the prospects for further study on a larger group of patients. Baseline concentrations of (IL-6) and soluble TNFR-2 receptor were significantly higher in the red group than in the white group. While IL-6 has an ambivalent effect, and various authors refer to it as both a pro and anti-inflammatory cytokine, sTNFR-2 has a pronounced anti-inflammatory effect [19, 20]. It is possible that an increase in the concentration of these cytokines may be associated with the immunosuppressive effect of pathogens in severe pneumonia. In the "white" group on the 3rd day, the concentrations of osteocalcin and TWEAK significantly increased and the concentrations of IL-1RA, IL-6, G-CSF, LIGHT, TSLP decreased. A decrease in the concentration of all cytokines, with the exception of IL-1RA, directly indicates a lesser severity of the inflammatory response, which may be directly related to the milder clinical course of VAP [21–25]. IL-1RA is an anti-inflammatory cytokine; a decrease in its plasma concentration can be a consequence of both excessive autoaggression of the immune system and a normal manifestation of the immune response [26]. Changes in the plasma concentrations of these cytokines in VAP require further study.
The lack of a significant differences between the absolute dynamics of parameters in the “white” and “red” groups can be explained by insufficient sample size. Further studies are required to investigate the predictive value of these cytokines as markers of the effectiveness of antibiotic therapy in VAP. In addition, it seems advisable to study the cytokine profile of patients when prescribing different broad-spectrum antibiotics.
The study of the plasma cytokine profile revealed statistically significant differences in the absolute dynamics of MMP-2 concentration in patients with a favorable and unfavorable clinical course of VAP. In the favorable course group, the average concentration increased significantly, while in the group with an unfavorable course of VAP, the plasma concentration of MMP-2 significantly decreased on the 3rd day of antibiotic therapy.
In addition to MMP-2, we obtained data on dynamic changes in the concentration of a number of other cytokines, which may be of interest for further study and require a larger sample size: IL-1ra, IL-6, G-CSF, LIGHT, osteocalcin, pentraxin, TSLP , TWEAK and IL-12.
The obtained results indicate the prognostic value of measuring the plasma concentrations of pro- and anti-inflammatory cytokines in the treatment of VAP.
Disclosure. The authors declare that they have no competing interests.
Author contribution. Zinina E.P., Tsarenko S.V., Logunov D.Y., Tukhvatulin A.I., Magomedov M.A., Babayants A.V., Avramov А.А. - all authors according to the ICMJE criteria participated in the development of the concept of the article, obtaining and analyzing factual data, writing and editing the text of the article, checking and approving the text of the article.