The new coronavirus infection (COVID-19) has caused a worldwide pandemic [1, 2]. The most severe clinical form of coronavirus infection was pneumonia with development of acute respiratory distress syndrome, which was the most frequent cause of death [3, 4]. Polymerase chain reaction (PCR) and antibody testing have become the reference methods for diagnosis of infection, but do not provide information on disease severity or prognosis [4]. Chest computed tomography (CT) is the most informative modality, but evidence has emerged that lung ultrasound (US) may be an effective alternative for diagnosing the extent and nature of lung tissue involvement [5–7]. This imaging modality is fast, cost-effective, and does not require ionizing radiation compared to CT. In addition, lung ultrasound can be repeated as many times as necessary to monitor disease progression and can be performed directly at the patient's bedside [8, 9].
In patients with COVID-19 pneumonia ultrasound signs were associated with chest CT changes. In the study by Nouvenne A. et al. (2020) the most typical ultrasound features were different areas of interstitial syndrome (confluent or discrete B-lines) with possible small or large subpleural consolidations and pleural line changes; pleural effusion was also rarely found in this study [10]. In a study by Ökmen K. et al, (2020), signs of lung damage in COVID-19 were present in 72.5 % of patients on CT scan and in 78.4 % of patients on ultrasound. A study by Chung M. et al. (2019) showed that in the right lung, the upper lobe was affected in 67 %, the middle lobe — in 57 %, and the lower lobe — in 76 %. In the left lung, the upper lobe is involved in the pathological process in 67 % of cases and the lower lobe in 67 %. Bilateral involvement of the pulmonary parenchyma was detected in 76 % of cases, and unilateral involvement (predominantly to the right) was observed in 10 % [11].
Currently, there are more and more papers on the use of lung ultrasound in COVID-19 both in the diagnosis and prognosis of the disease. One of the first studies showing the correlation between CT and ultrasound was the study of Nouvenne A. et al. (2020), which demonstrated the importance of using ultrasound in the early stages of the disease [10]. Subsequent comparative studies in different countries have noted a varying degree of comparability between ultrasound and CT findings [12–14]. Soldati G. et al. (2020) suggested using of ultrasound to triage patients with COVID-19 pneumonia at the pre-hospital stage, which would greatly simplify the work in pandemic conditions [15, 16].
The aim of our study to determine the relationship between ultrasound-guided lung lesion index (UIL) of 16-zone modified protocol with the severity of respiratory failure, the volume of lung involvement by CT and outcomes in patients with COVID-19.
The prospective observational cohort clinical study was conducted at the Military Medical Academy, Saint Petersburg. The study was approved by the independent Ethics Committee of the Military Medical Academy (protocol No 236 dated 21.05.2020). Inclusion criteria for the study were the following: age of patients 18-75 years; development of pneumonia COVID-19 or suspected COVID-19. Inclusion criteria were: presence of pneumothorax; history of chest trauma or lung surgery; background specific diseases (tuberculosis, sarcoidosis). A total of 388 patients took part in the study. General characteristics of the patients at the time of inclusion in the study are presented in Table 1.
Table 1. Characteristics of patients included in the study
| Characteristics | Value | |
|---|---|---|
| Age, years (М ± SD) | 52.6 ± 10.5 | |
| Sex (male/female), n | 267/121 | |
| Height, cm (М ± SD) | 173.4 ± 12.4 | |
| Body weight, kg (М ± SD) | 94.2 ± 17 | |
| Body mass index, kg/m2 (М ± SD) | 31.2 ± 4.7 | |
| Day of illness on admission to hospital (М ± SD) | 5.4 ± 2.0 | |
| Moderate/severe pneumonia, n | 184/204 | |
| Number of patients with baseline decreased (< 94 %) saturation when breathing atmospheric air, n (%) | 252 (64.9 %) | |
| Lung lesion volume on CT scan, %, Ме (Q1; Q3) | 55 (35; 74) | |
| Degree of CT lesion | 2, n (%) | 207 (53.4) |
| 3, n (%) | 156 (40.2) | |
| 4, n (%) | 25 (6.4) | |
| Concomitant diseases | Diabetes mellitus, n (%) | 78 (20.1) |
| Obesity, n (%) | 193 (49.7) | |
| Hypertensive disease, n (%) | 252 (64.9) | |
| Coronary heart disease, n (%) | 95 (24.5) | |
| Chronic heart failure, n (%) | 20 (24.5) | |
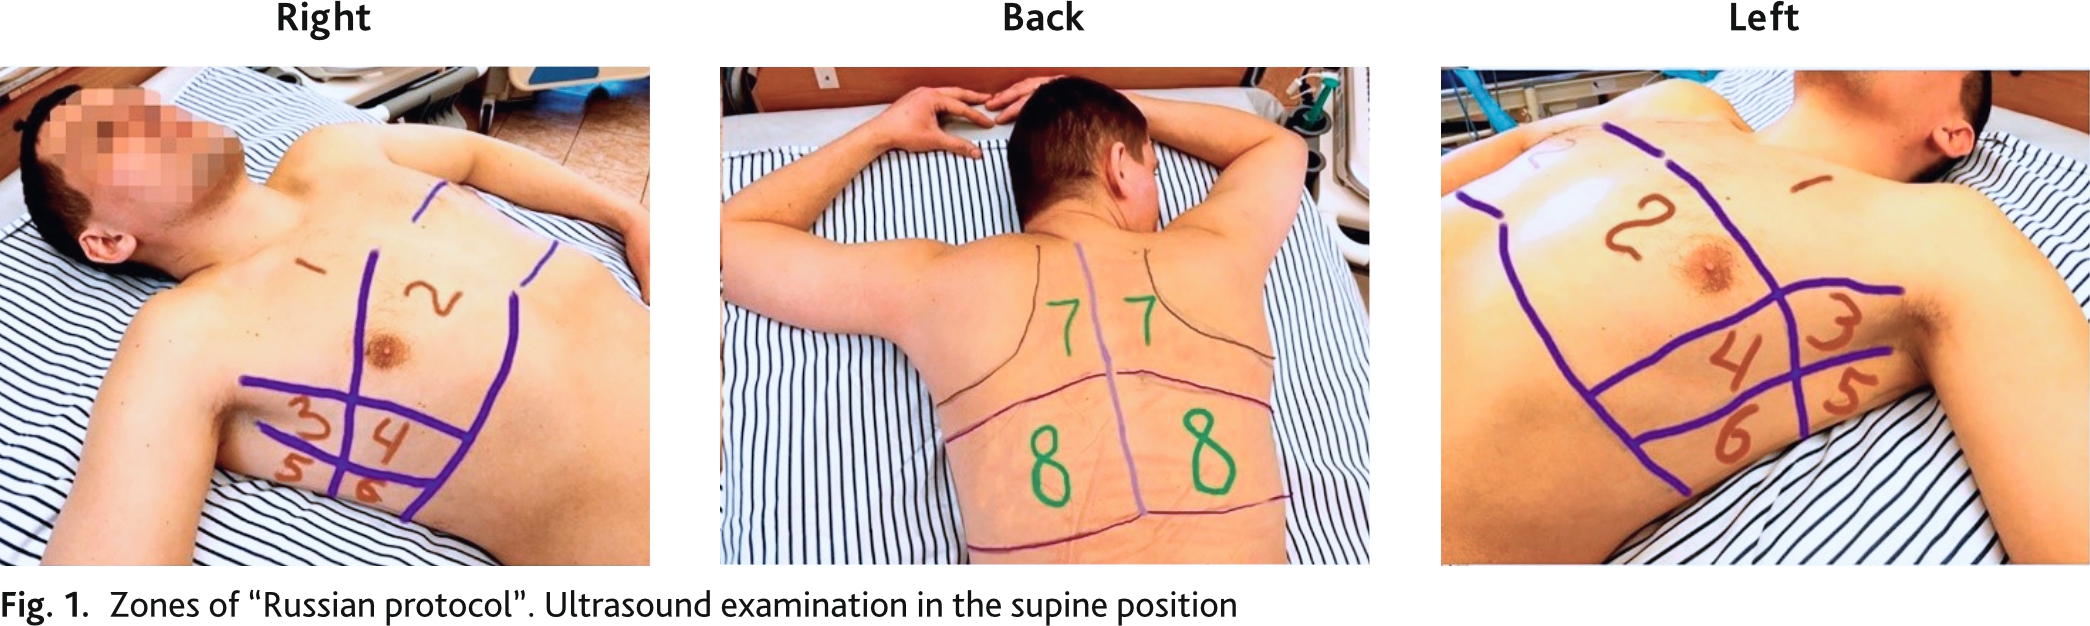
Bedside ultrasound examination was performed by portable ultrasound machine (Mindray M7, China), C5-2s convex transducer (2.5–5 MHz). The imaging procedure was standardized using a preset abdominal examination, with a maximum depth of 18 cm, focusing on the pleural line. Gain was adjusted to obtain the best image of the pleura, vertical artifacts, and subpleural consolidations with or without air bronchograms. All harmonics and software to reduce artifacts were disabled. The study was performed in the supine or sitting position, depending on the patient's condition. Lung ultrasound examination was performed according to the 16-zone “Russian protocol” (eight zones on the right and left) (rationalization proposal No. 15165, VMedA protocol No. 4 dated December 15, 2020) (Fig. 1) [17].
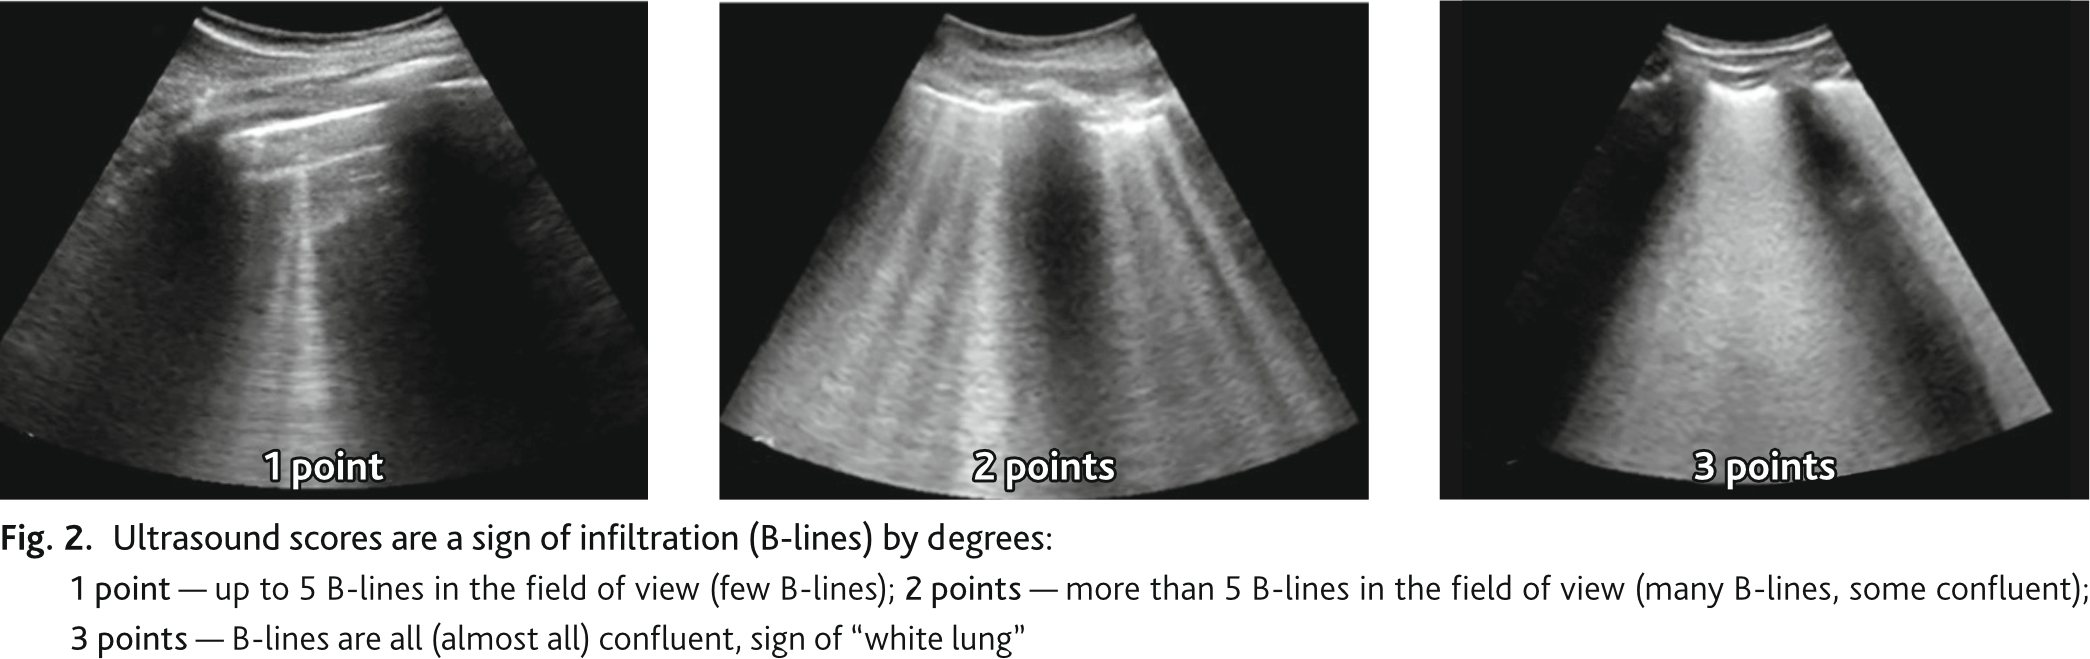
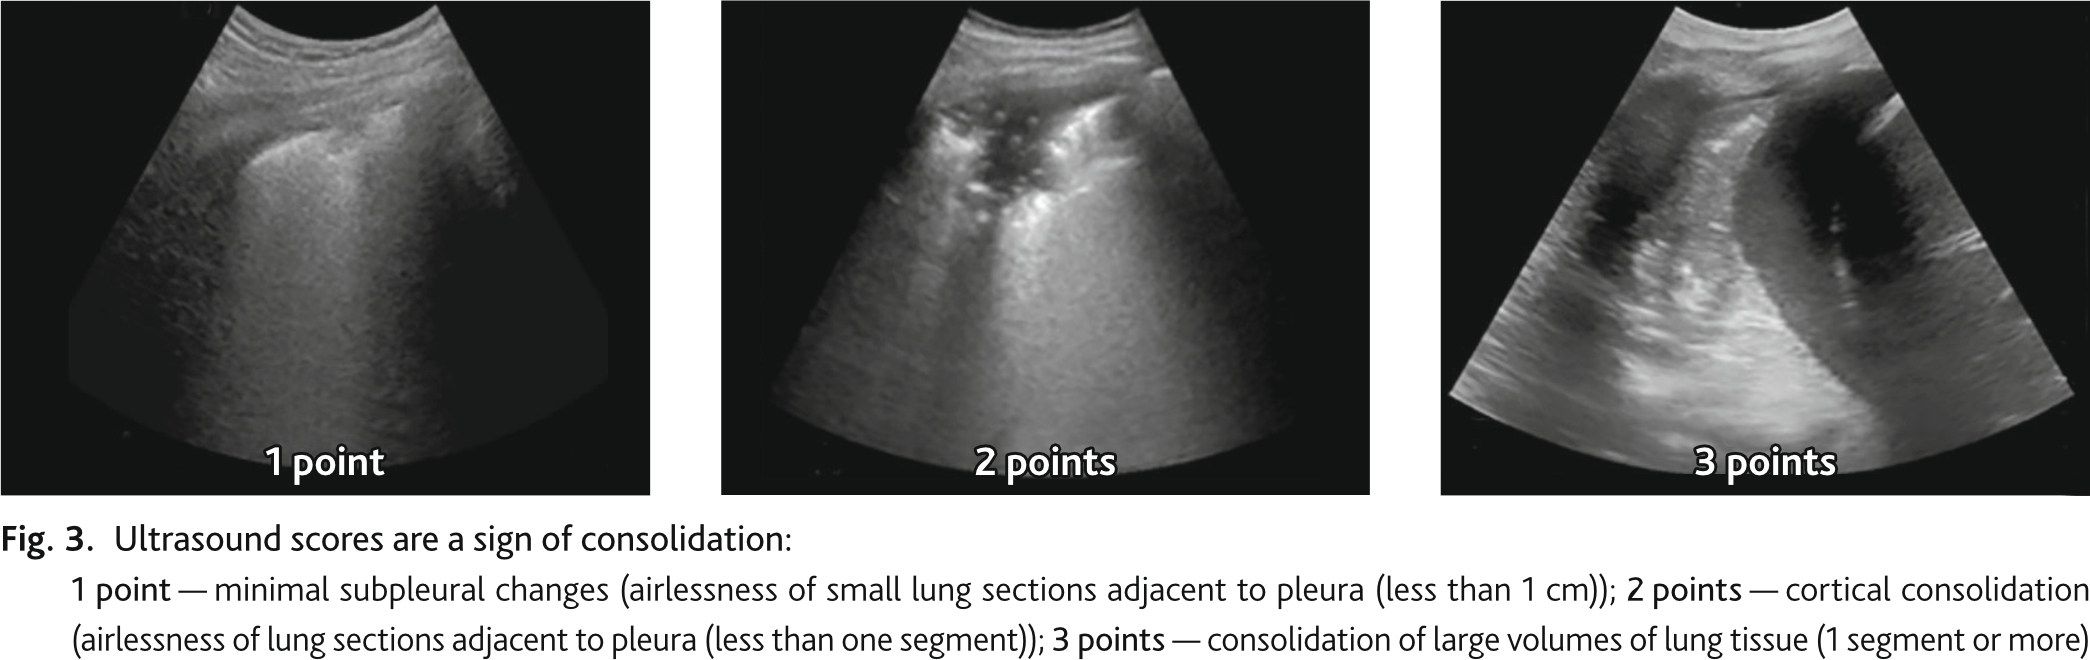
During ultrasound examination we determined pathological signs, signs of lung infiltration and consolidation, which were recorded according to the protocol zones. The ultrasound signs of infiltration and consolidation were scored by degree in each zone separately. Ultrasonic sign of infiltration (B lines): 1 point — up to 5 B-lines in the field of view (few B lines); 2 points — more than 5 B-lines in the field of view. (many B lines, some confluent); 3 points — B-lines are all (almost all) confluent, sign of “white lung” (Fig. 2). Ultrasound sign of consolidation: 1 point — minimal subpleural changes (airlessness of small sections of lung adjacent to pleura (less than 1 cm)); 2 points — cortical consolidation airlessness of sections of lung adjacent to pleura less than one segment); 3 points — consolidation of large volumes of lung tissue (1 segment or more) (Fig. 3). UIL score was calculated by summing the points of ultrasound signs of infiltration and consolidation in all 16 zones.
Chest CT was performed for clinical indications (diagnosis, worsening clinical picture), the results were evaluated by a radiologist blinded to the results of lung ultrasound. CT scans were performed on a Philips Ingenuity machine. Pathological signs were registered by lung segments. Evaluation of lung involvement volume in patients with suspected/known COVID-19 pneumonia was performed using visual assessment.
Data were analyzed using SPSS-26 for Windows (Statistical Package for Social Science, SPSS Inc. Chicago IL, USA). The variables were examined using visual (histograms, probability plot) and analytical methods (Kolmogorov-Simirnov-Shapiro-Wilk criterion) to determine whether they were normally distributed. With a normal distribution, data were represented by the mean and standard deviation M (± SD); descriptions of quantitative data that did not obey the law of normal distribution were presented as the median and the 25th and 75th percentiles, Me (Q1; Q3). Analysis was performed to describe and summarize the distributions of the variables. The description of frequencies in the studied sample is presented with a mandatory reference to the cited sample characteristic (n (%)). Spearman rank correlation coefficient was used to study the association of UIPL with lung lesion volume and SpO2/FiO2 index. Differences were considered statistically significant at p ˂ 0.05. Sensitivity (Se), specificity (Sp) of ultrasound methods were assessed on the basis of ROC-analysis. We performed visual assessment of ROC curves, calculated sensitivity and specificity indices, and determined the area under the ROC curve and coordinates. The optimal cut-off point was defined as the highest Youdens Index (sensitivity + specificity – 1).
Study of cumulative survival and prediction of adverse outcome by UIL was performed by Kaplan–Meier method. Differences between groups were tested using the log-rank test (Log Rank (Mantel–Cox)) and the Breslow test (Generalized Wilcoxon). Multivariate Cox regression analysis was performed to identify potential predictors of death; SpO2/FiO2 index, lesion volume according to CT and UIL data were selected as predictors. Multivariate models were constructed using the stepwise exclusion method. Tests were considered statistically significant at p < 0.05.
388 patients were included in the study. During admission patients were underwent CT and lung ultrasound (267 men, 121 women; mean age 52.6 ± 10.5 years). The time difference between CT and lung ultrasound was 8 (2; 13) hours. The most frequent symptoms were fever (372 (95.9 %)), cough (114 (80.9 %)), and shortness of breath (147 (37.9 %)). The duration of symptoms before admission was 5.4 ± 2.0 days. 252 (64.9 %) patients were required oxygen therapy. Clinical characteristics of the patients are shown in Table 1.
The patients were distributed according to the СT degree of lung injury: CT 2 — 207 (53.4 %); CT 3 — 156 (40.2 %); CT 4 — 25 (6.4 %) (Table 1). The median volume of lung involvement in CT was 55 (35; 74) %, UIL was 46 (28; 60). Bilateral lung injury was in 100 % of cases. The ultrasound signs matched CT signs. If pleural thickening was detected on CT, then a thickened pleural line was also visualized on ultrasound. The most common in CT was “ground-glass opacity” type thickening of pulmonary parenchyma, which in ultrasound corresponded to B-lines (multifocal, discrete or merging). If reticular thickenings of interstitium reached pleura or consolidation zone, they were determined by ultrasound as B-lines (more often discrete). The sign of lung consolidation on CT corresponded to the ultrasound sign of consolidation on lung ultrasound.
Blood oxygen saturation during independent breathing with air (for calculations, oxygen concentration in air was defined as 21 % was SpO2 — 93 (86; 97), SpO2/FiO2 ratio — 443 (390; 462).
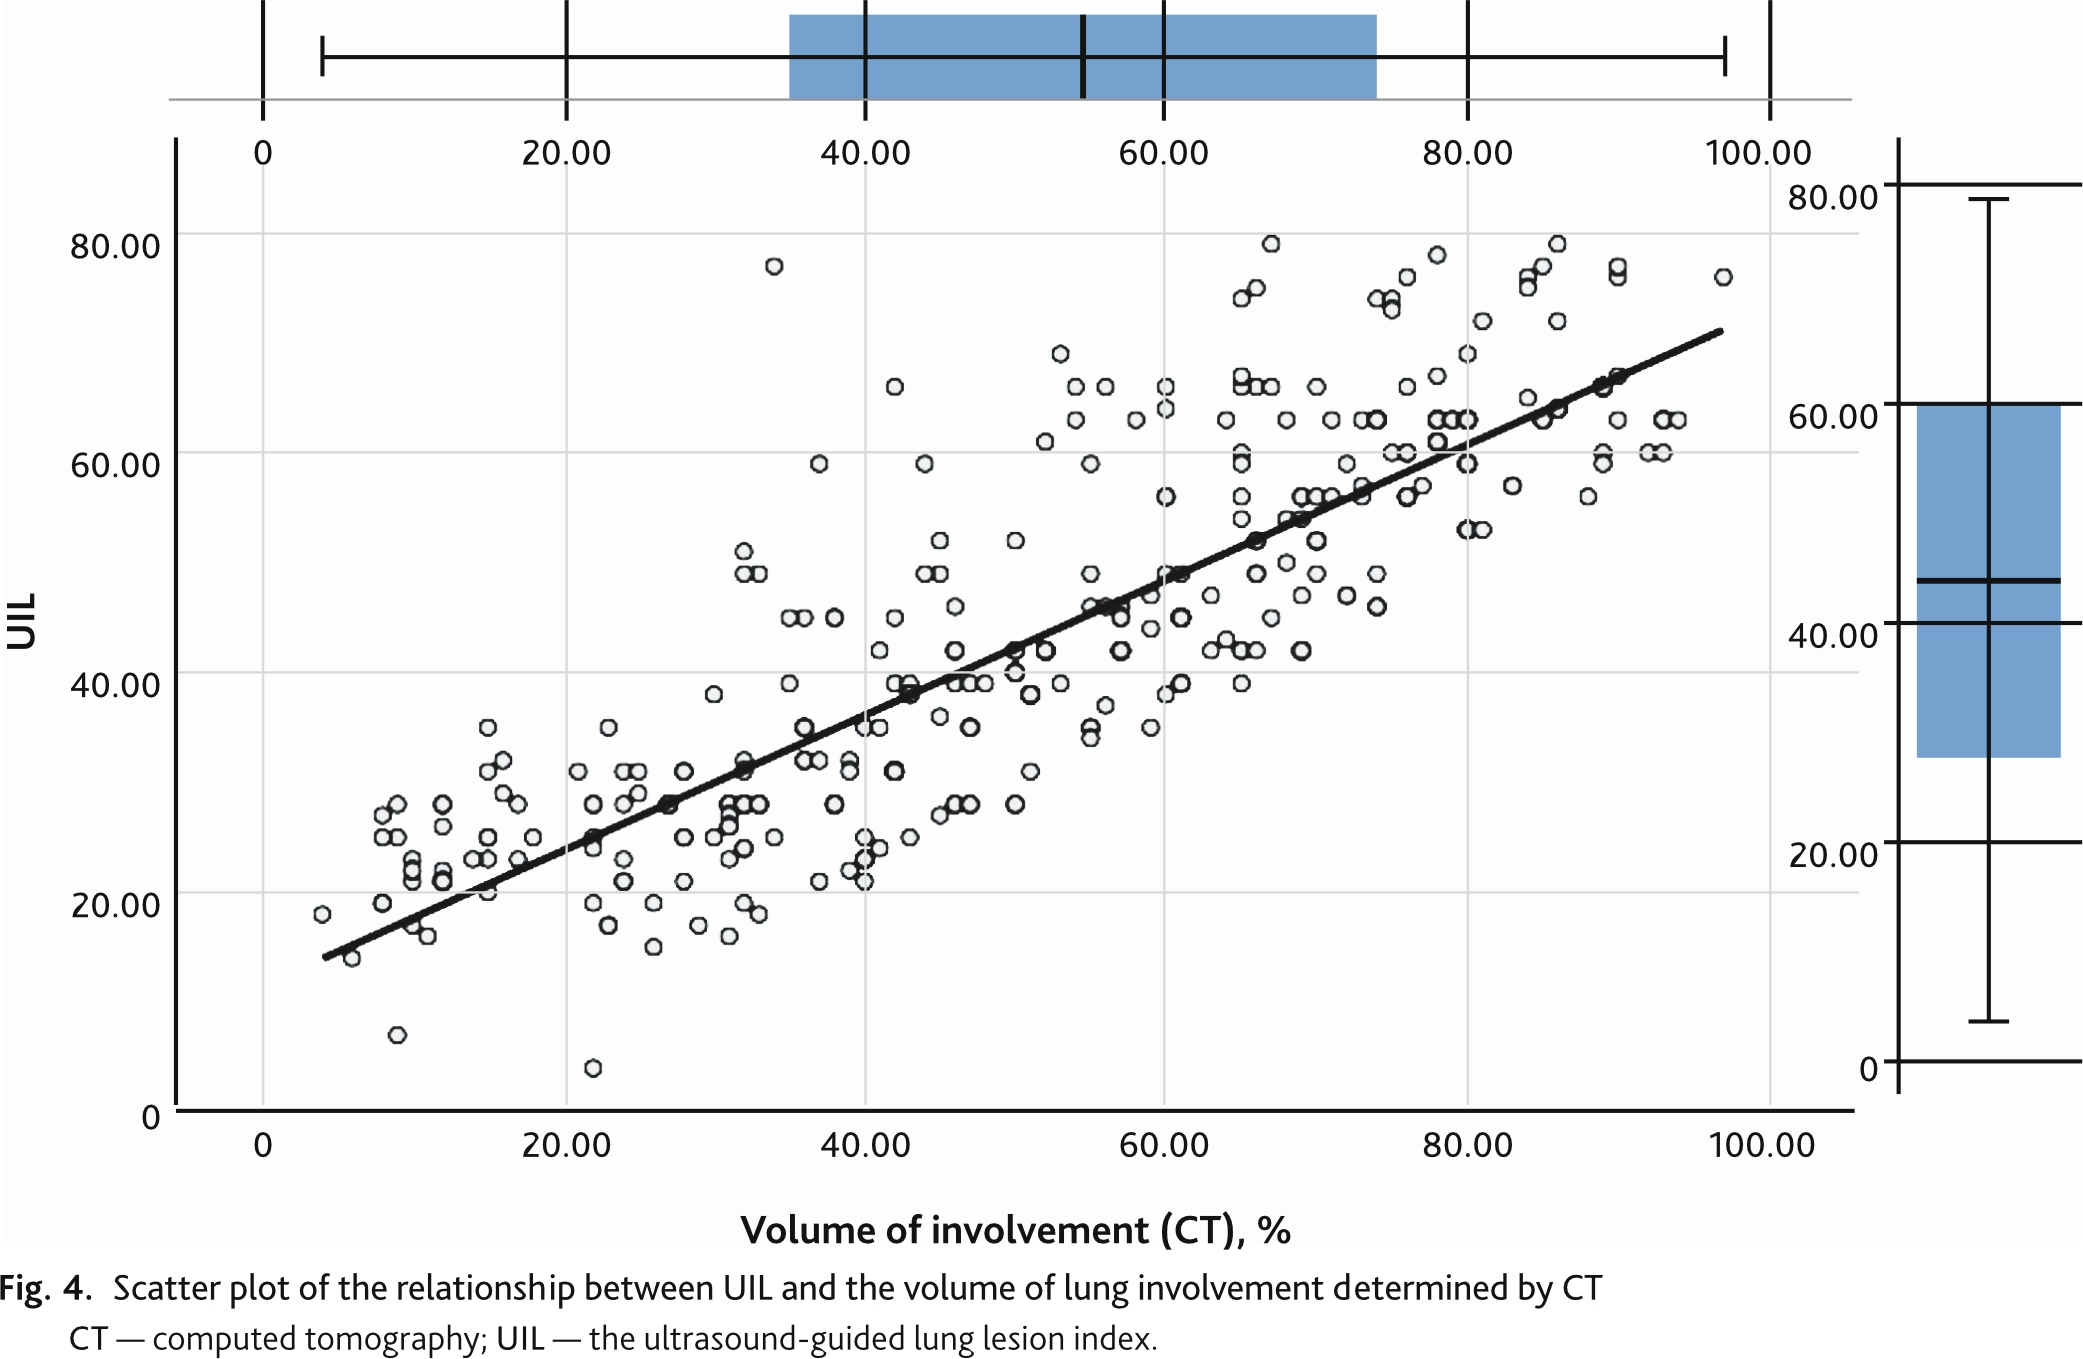
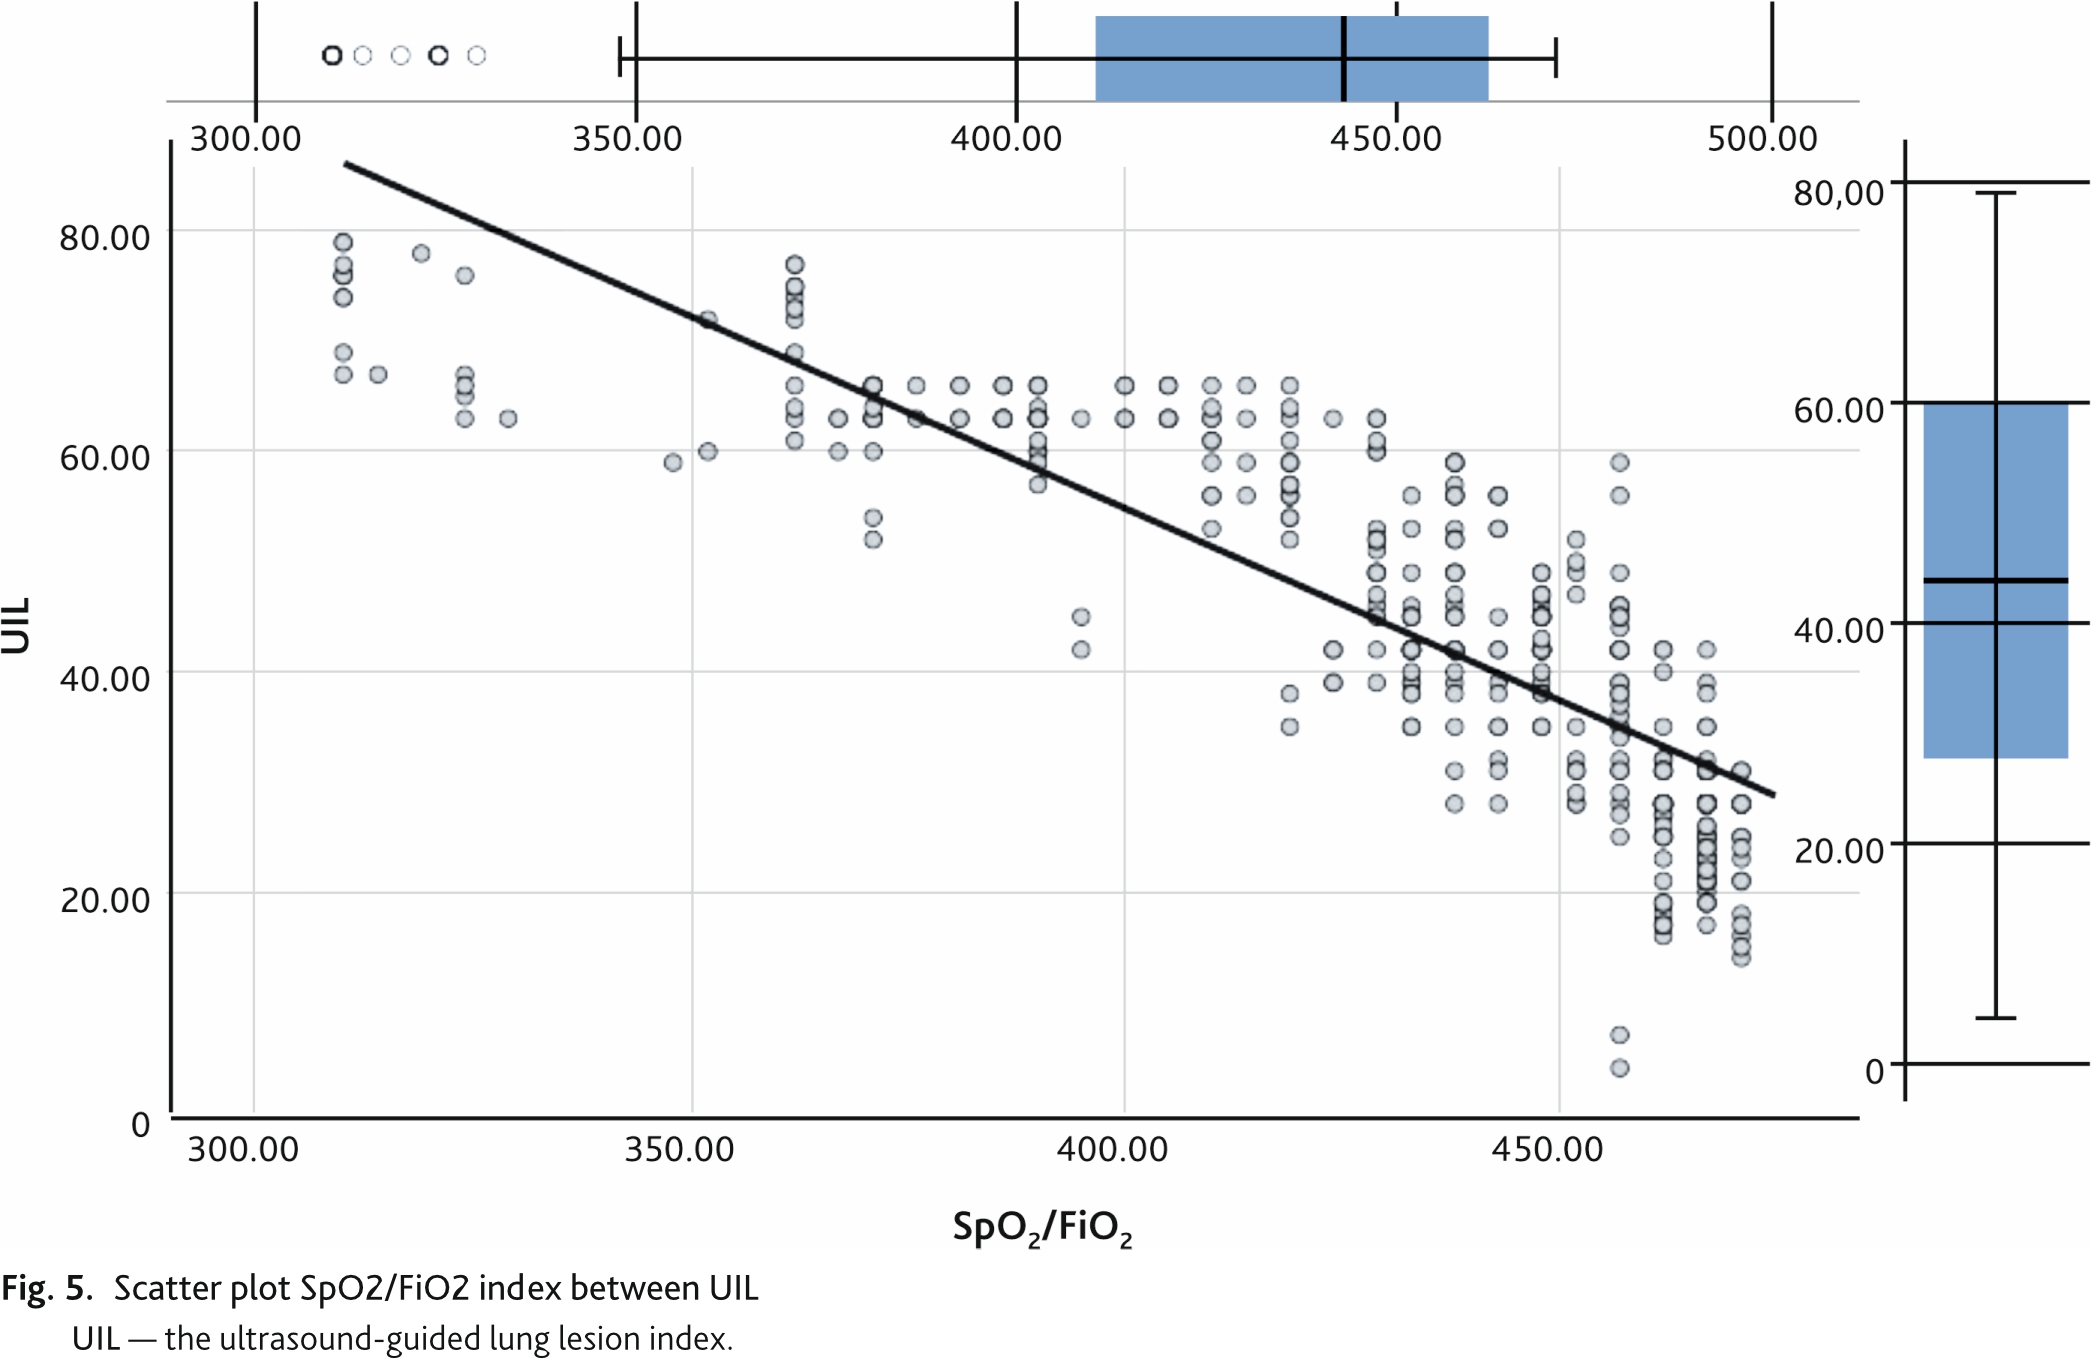
The change in UIL determined by the Russian Protocol had a strong direct correlation of 0.873 (95% CI 0.842; 0.897, p < 0.01) with the change in lung involvement volume determined by CT (Fig. 4). The correlation of UIL with the SpO2/FiO2 index was also strong but reversed –0.850 (95% CI 0.827; 0.871, p < 0.01) (Fig. 5).
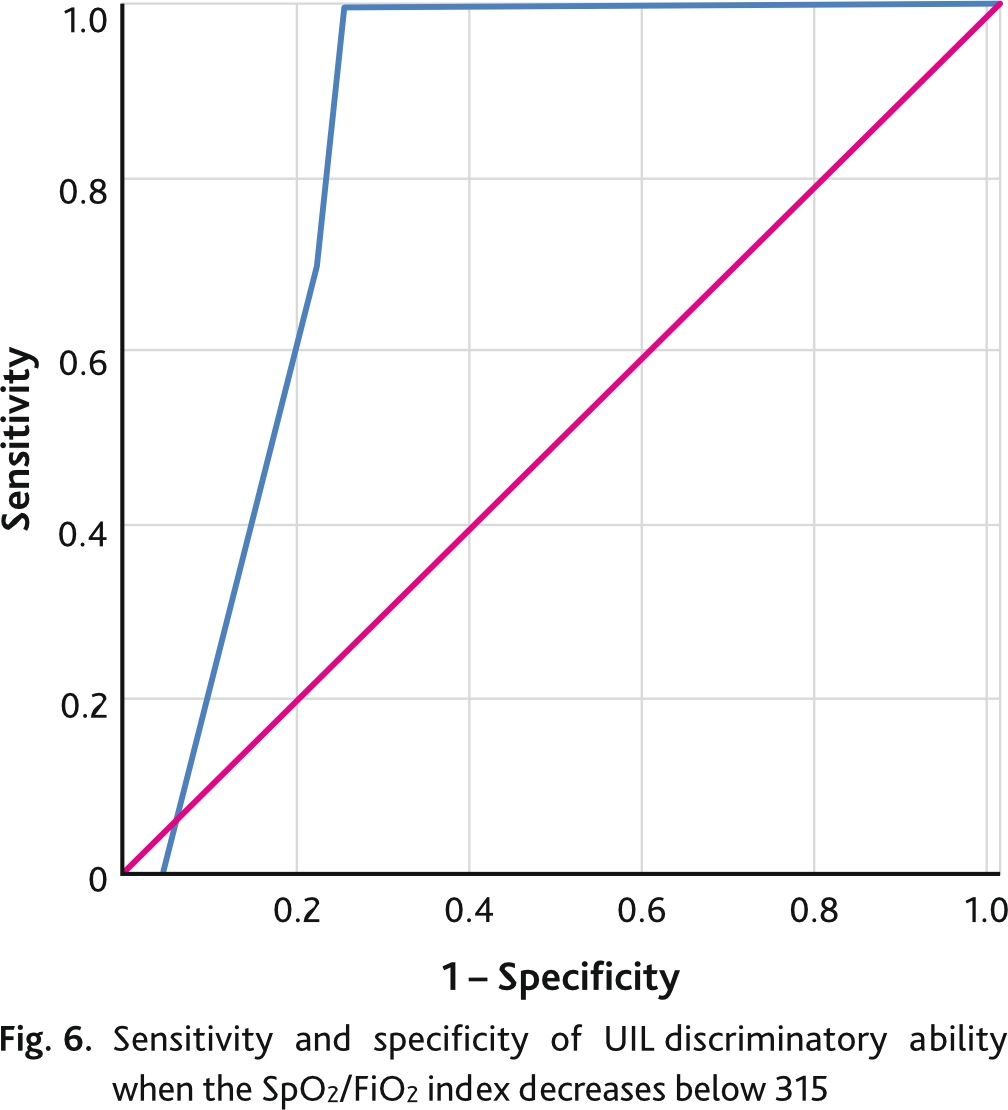
Decrease of SpO2/FiO2 index below 315 indicates development of acute respiratory distress syndrome. The discriminative ability of UIL and SpO2/FiO2 index reduction below 315 was assessed by ROC analysis with calculation of area under the curve (AUC ROC) with 95% CI and cut-off point, which corresponded to the best combination of sensitivity and specificity (Youdens Index) (Fig. 6). The discriminatory power of the ROC index and SpO2/FiO2 index reduction of less than 315 was 44 points or higher with an area under the curve of 0.837 (95% CI 0.766; 0.909) (p = 0.03), sensitivity of 96 %, and specificity of 78 %.
Lethality in the study group was 56 (14.4 %) out of 388 patients included in the study. Median time to adverse outcome in deceased patients was 7 (4; 14) days.
The ROC analysis of the UIL curve for predicting mortality is shown in Fig. 7. The area under the curve was 0.896 (95% CI 0.861; 0.931) (p = 0.018). The optimal cutoff point, defined as the highest Juden index for UIL in predicting adverse outcome in patients with COVID-19 pneumonia was 55 points and had a sensitivity of 97.6 % and specificity of 73.9 %.

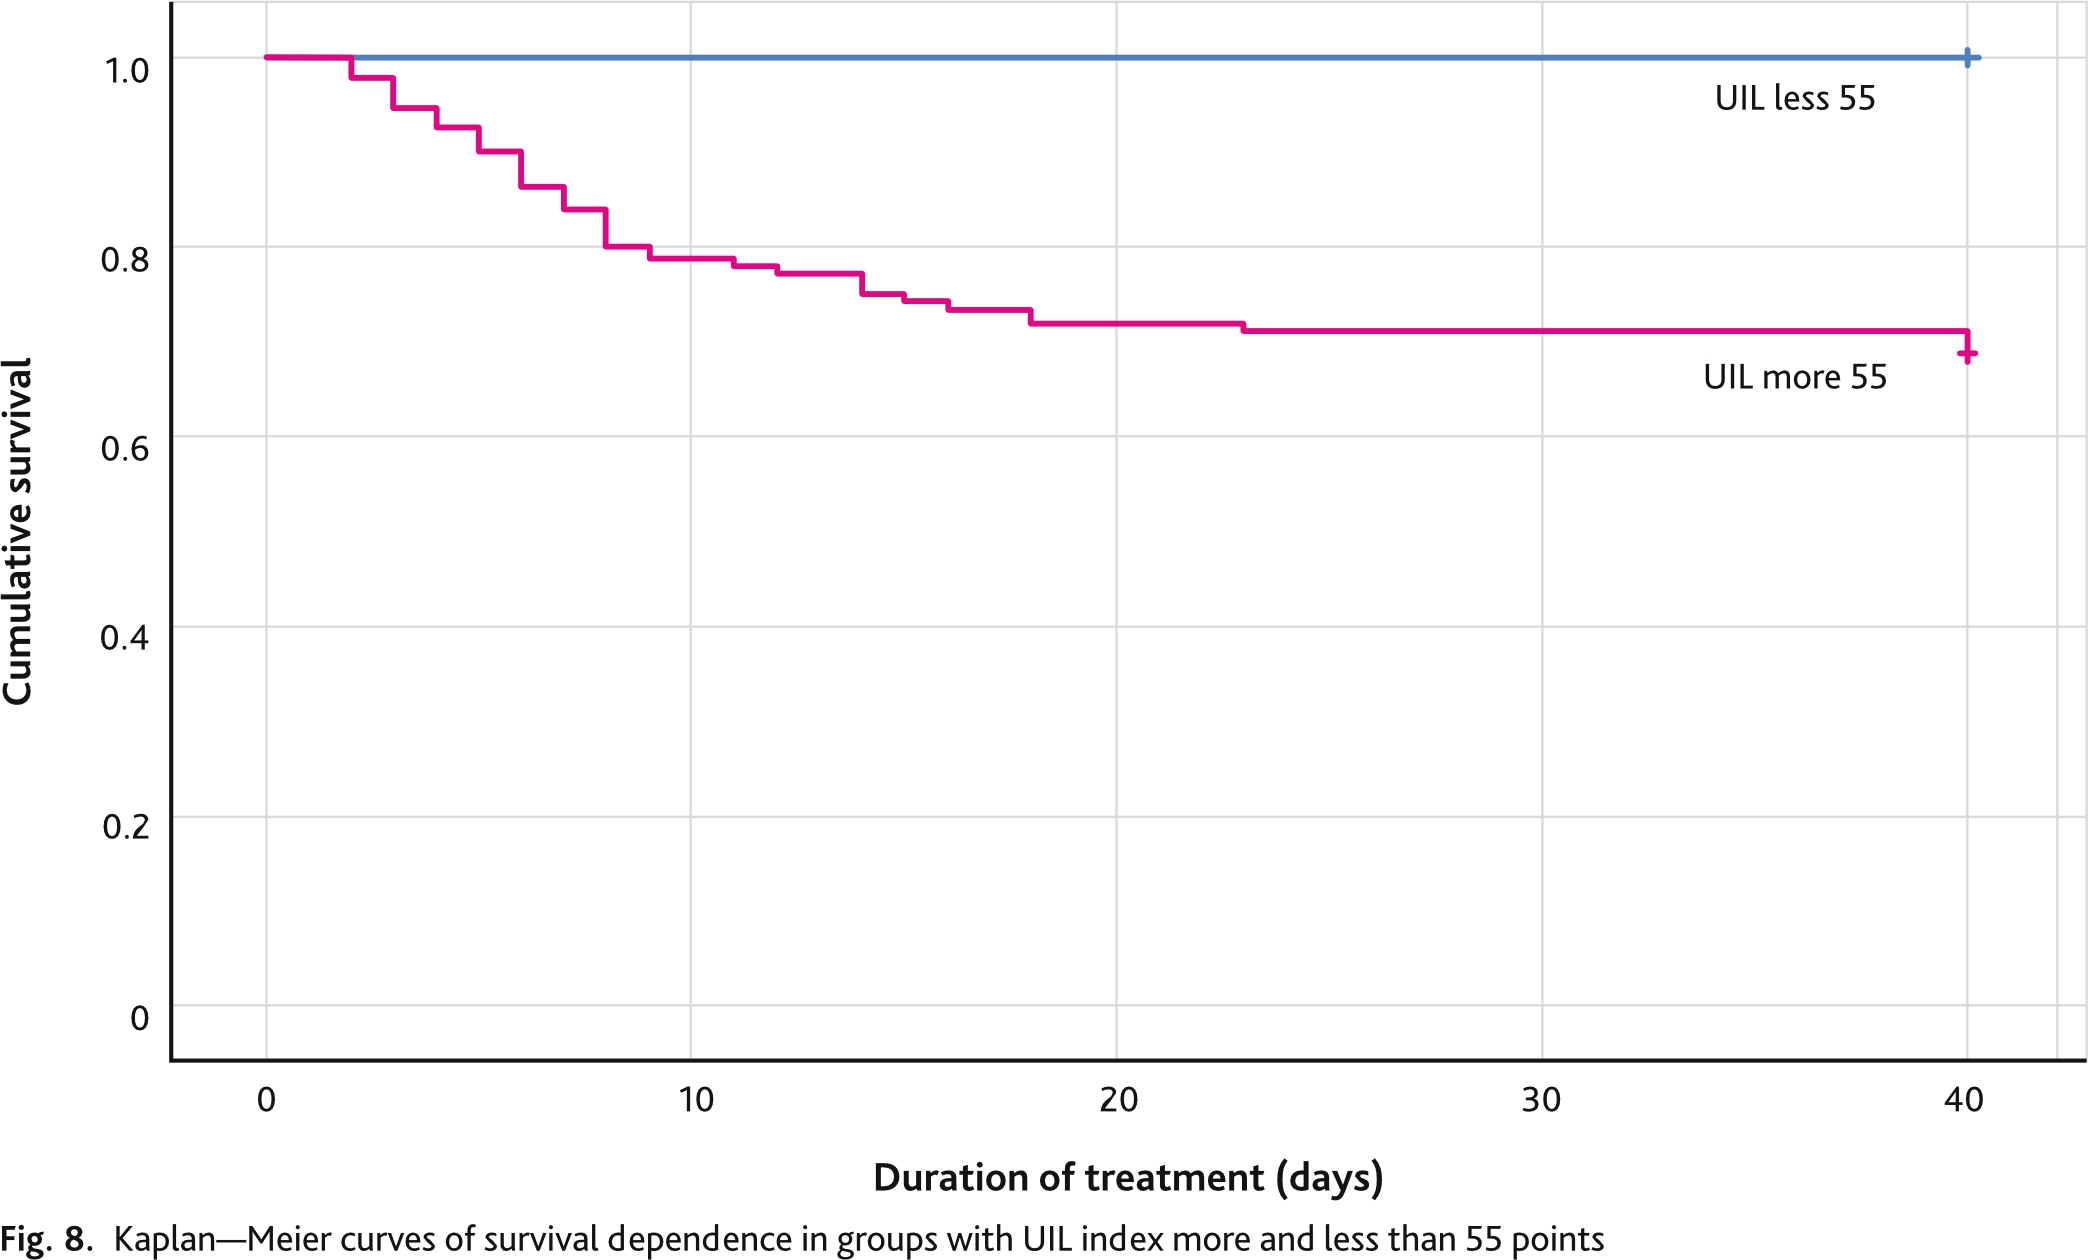
The Kaplan–Meier study was based on the cutoff point for predicting mortality from ROC analysis. To introduce a categorical variable, groups with UIL values more than 55 points and less than 55 points were formed. Kaplan–Meier analysis on the data set (n = 388) demonstrated a survival rate of 97.6 % in the group with a UIL score less than 55 and 62 % in the group with a UIL score more than 55 (Fig. 8). The differences between the groups were statistically significant (Log Rank test p < 0.001; Breslow test p < 0.001). When analyzing the curves, we can clearly see that the steepest part in the group of patients with an UIL score of more than 55 points lasts for the first 7 days, then the flat part of the curve begins. This means that with an UIL lower than 55 points, most of the adverse outcomes occurred during the first week of treatment. In the group with an UIL score less than 55 points, there was a flat curve line during the first 2 weeks, then a maximum slope during 3 days and then a flat line again. This underscores the nature of the course of the disease with the development of complications and adverse outcomes in the long-term period compared to the group of patients with an UIL score of less than 55.
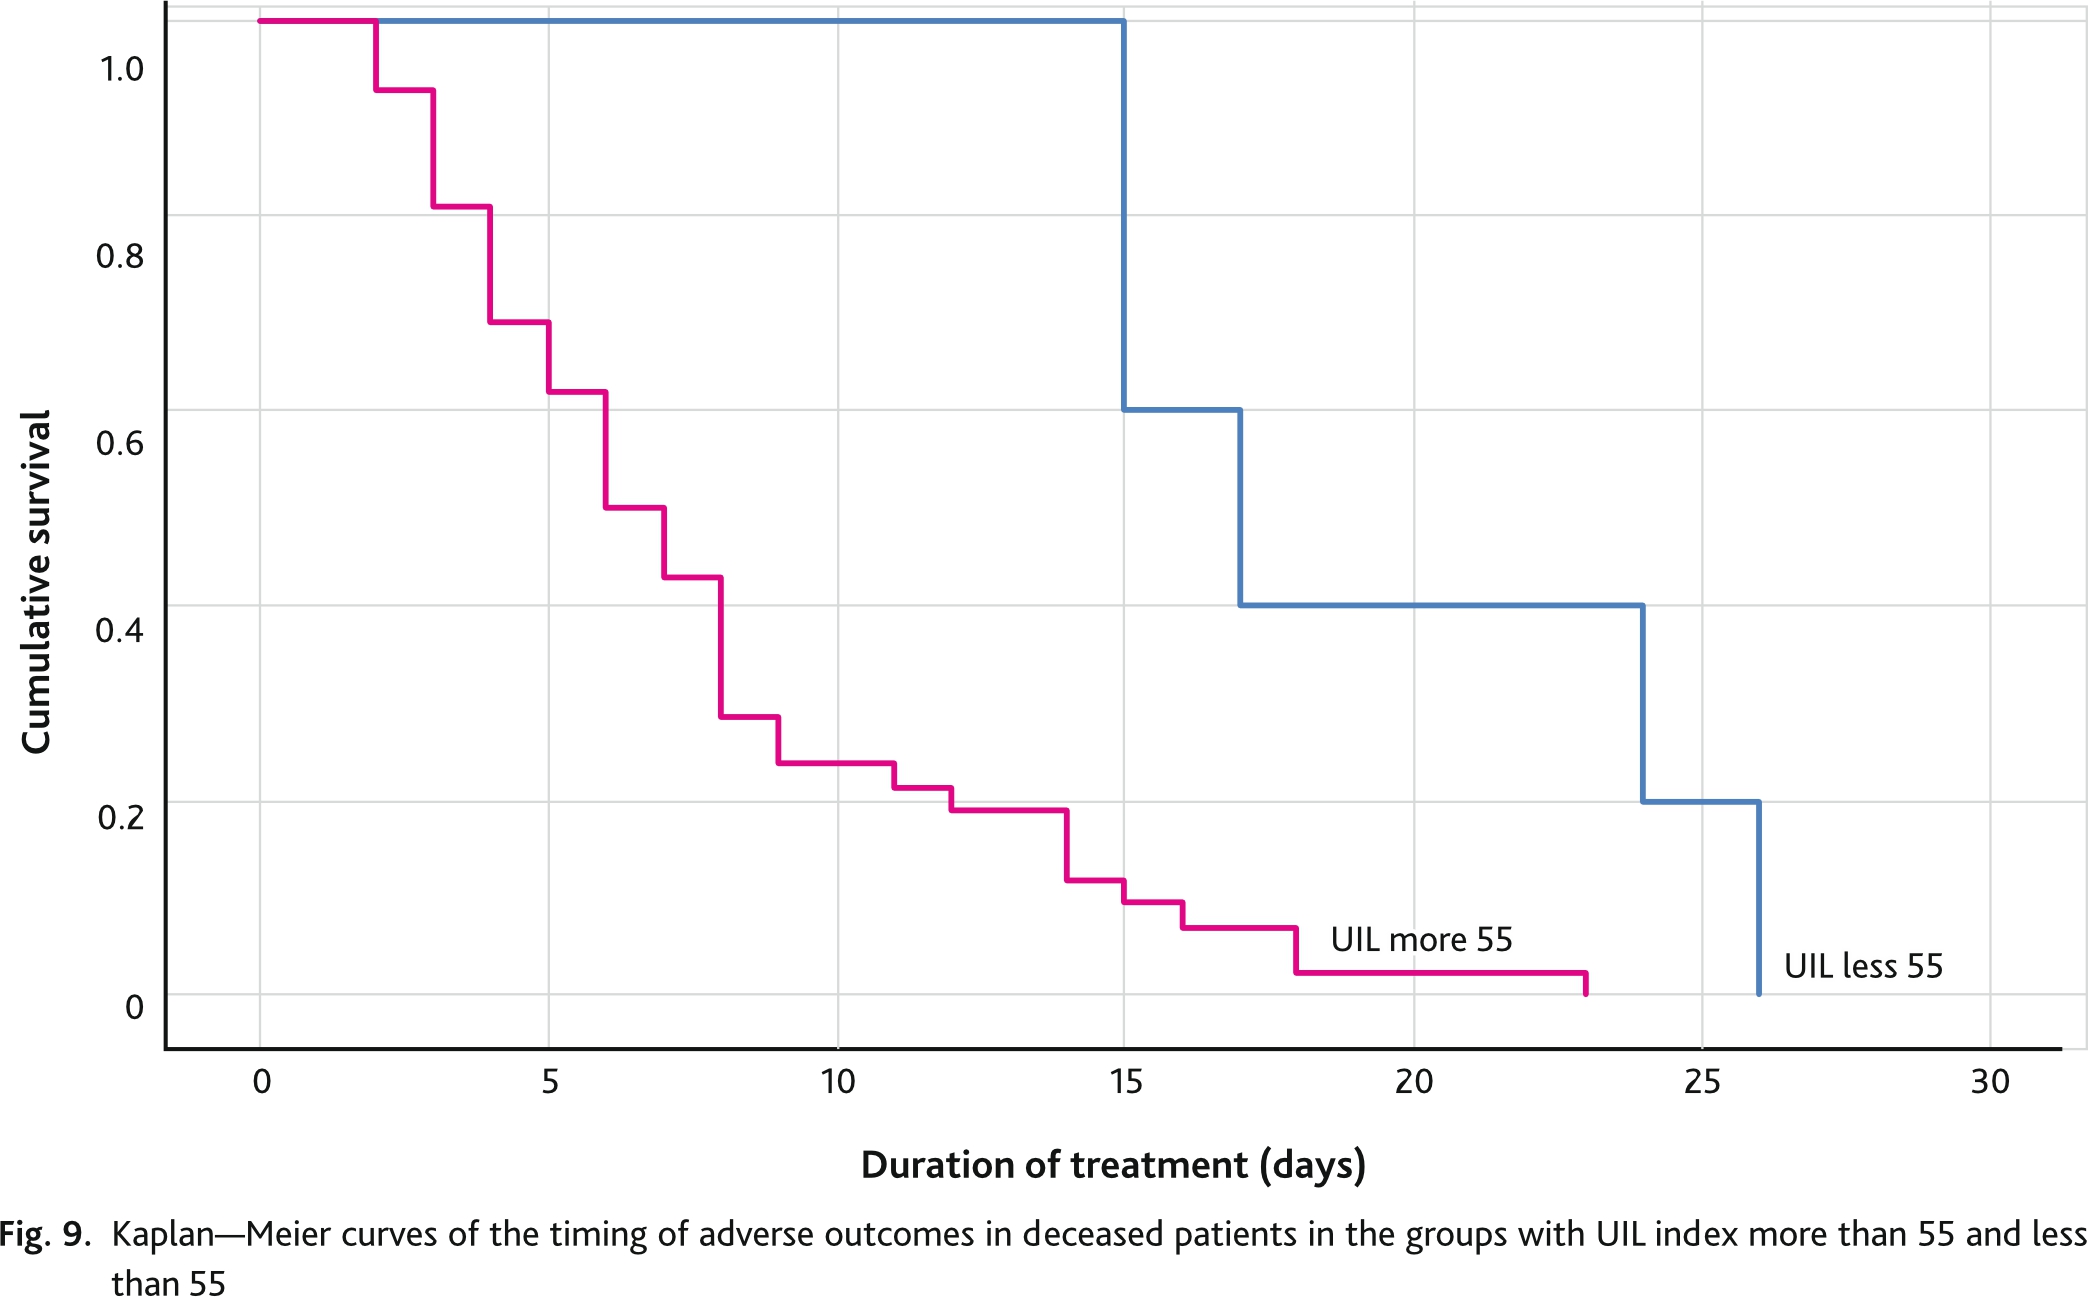
Separate analysis of deceased patients (n = 56) showed that life expectancy was longer in the group with an UIL score less than 55 points and was 17 (95% CI 12.7; 21.3) days. In the group with an UIL score more 55 points was 7 (95% CI 5.4; 8.6) days. The differences between the groups were statistically significant (Log Rank test p = 0.002; Breslow test p = 0.005) (Fig. 9).
For identifying potential predictors of death, we selected SpO2/FiO2 index, lesion volume of CT data, UIL, and performed multivariate Cox regression analysis using the stepwise exclusion method. Given the small number of predictors included in the analysis, the regression model was built in 3 steps (Table 2). In the first step, the SpO2/FiO2 index was excluded from the model as the index with the least influence on the timing of adverse outcome and the highest level of significance greater than 0.05 (Exp (B) = 0.993; p = 0.199). In the second step, the predictor of lung lesion volume determined by CT scan was excluded from the model (Exp (B) = 1.013; p = 0.246). As a result, in the multivariate Cox regression analysis model, only UIL remained a significant predictor of adverse outcome (p < 0.01).
Table 2. Indices of multivariate Cox regression analysis, using the stepwise exclusion method
| Step | Predictor | B | Valid | р | Exp (B) | DI 95,0 % for Exp(B) | |
|---|---|---|---|---|---|---|---|
| Lower | Upper | ||||||
| 1 | SpO2/FiO2 | –0.0007 | 1.652 | 0.199 | 0.993 | 0.983 | 1.004 |
| CT lesion volume | 0.016 | 2.019 | 0.155 | 1.017 | 0.994 | 1.040 | |
| UIL | 0.081 | 10.021 | 0.002 | 1.084 | 1.031 | 1.140 | |
| 2 | CT lesion volume | 0.013 | 1.344 | 0.246 | 1.013 | 0.991 | 1.034 |
| UIL | 0.107 | 46.300 | 0.000 | 1.121 | 1.179 | 1.197 | |
| 3 | UIL | 0.114 | 71.794 | 0.000 | 1.214 | 1.202 | 1.291 |
| CT — computed tomography; SpO2/FiO2 — ratio of oxygen saturation to fraction of inhaled oxygen; UIL — ultrasound lung lesion index. | |||||||
This study, like many others during the COVID-19 pandemic, was performed in a variant of bedside focused ultrasound examination. Typical ultrasound signs of pneumonia have been defined and popularized in the works of the founder of the trend D. Lichtenstein, as well as consensus papers [18–22]. In our study, as well as in others, ultrasound signs of pneumonic tissue lesion were pleural thickening, B-lines of different characteristics (multifocal, discrete or confluent) and consolidation sign.
Determined using the 16-zone “Russian Protocol” UIL showed a strong direct correlation with the extent involvement of the lungs in the pathological process in coronavirus infection. The higher was the index value, the higher volume of lung tissue was affected by pneumonia. A number of publications on lung ultrasound in COVID-19 showed correlation between ultrasound indices of some study protocols with the degree of respiratory failure and various risks. In Chardoli M. et al. (2021) multivariate logistic regression demonstrated the ability of lung ultrasound to predict the need for mechanical ventilation (area under the curve 0.80) and the risk of hospital mortality (area under the curve 0.87) [23]. Lichter Y. et al. (2020) showed that pulmonary ultrasound is strongly correlated with the need for invasive mechanical ventilation and it is a strong predictor of mortality [24]. In a study by Secco G. et al. (2021) was a 12-zone protocol, ultrasound lesion index correlated with Horowitz index (P/F) on oxygen inhalation (R2 0.68; p < 0.0001) and P/F on atmospheric air breathing (R2 0.59; p < 0.0001) [25]. Approximately the same correlation (R2 –0.697; p < 0.0001) of ultrasound index and P/F was found by Sumbul H.E. et al. (2021) [26].
Available data in the literature showed that survivors patients had a lower lung ultrasound score than patients who died [27, 28]. Semiquantitative assessment of extravascular lung water and, indirectly, blood oxygenation is performed during lung ultrasound examination [29, 30]. Low lung ultrasound score means less impaired lung aeration in patients with COVID-19 [31, 32]. In published studies, lung ultrasound data have been associated with mortality in COVID-19. Lung ultrasound has been associated with several proven predictors of adverse outcome in COVID-19, including: CT severity score, C-reactive protein, interleukin-6 (IL-6), D-dimer, and RaO2/FiO2 index [10, 33–35], C-reactive protein [36], IL-6 [37], and D-dimer levels [38]. The correlation with PaO2/FiO2 index was negative [25, 32, 37–39]. All these correlations illustrate that a high lung ultrasound score is a potential risk factor for patients with COVID-19.
Lung ultrasound score was associated with the need for respiratory support, hospitalization or intensive care unit admission [9, 29, 40], although it should be noted, that additional studies are needed to confirm these findings. Pulmonary ultrasound has been connected with the severity of COVID-19. According to a meta-analysis by Song G. et al, 2021, a high lung ultrasound score means a more severe course of COVID-19 [28]. A number of studies have already used lung ultrasound score as a tool to stratify risks of complications and outcomes for patients with COVID-19. Several studies have proposed cutoff point values of lung ultrasound scoring for COVID-19 mortality and severity [24, 25, 34, 40–42]. The cutoff point values for predicting adverse outcome in different studies were 13 [25], 16 [40], 17 [42], 18 [24], 20 [33], 22.5 [39], 24 [38], 25 [27], 30 [29] days, of course depending on the using lung ultrasound protocol. The cut-off point value for predicting severe COVID-19 was 7, with a sensitivity of 80.8 % and specificity of 95.8 % [34]. In Claudio T., 2022, as well as in our study, lung ultrasound was the only independent predictor of hospital mortality 7.42 (95% CI: 1.59–34.5) [33] in multivariate Cox regression analysis.
Therefore, the most studies, in the context of our work are concluded that lung ultrasound is useful tool for assessment and risk stratification in patients with COVID-19, primarily of adverse outcome.
UIL determineed by 16-zone “Russian protocol” had a strong direct correlation with the volume of lung involvement by CT and a strong inverse correlation with the SpO2/FiO2 index. Discriminatory power of ultrasound and SpO2/FiO2 index reduction less than 315 as an indicator of acute respiratory distress syndrome was 44 points or higher with sensitivity of 96 % and specificity of 78 %. Lethality in the study group was 56 (14.4 %). The optimal cutoff point in the ROC analysis for UIL was 55 points in predicting adverse outcome in patients with COVID-19 pneumonia and a sensitivity of 97.6 % and specificity of 73.9 %. Kaplan–Meier analysis demonstrated a survival rate of 97.6 % in the group with a UIL score less than 55 points and 62 % in the group with a UIL score more than 55 points. Multivariate Cox regression analysis, using the stepwise exclusion method, left only UIL as a significant predictor of adverse outcome.
Disclosure. The authors declare that they have no competing interests.
Author contribution. All authors according to the ICMJE criteria participated in the development of the concept of the article, obtaining and analyzing factual data, writing and editing the text of the article, checking and approving the text of the article.
Ethics approval. This study was approved by the independent Ethical Committee of the Military Medical Academy (reference number: 236-21.05.2020).