Today sepsis remains an actual problem of modern medicine because of high morbidity and mortality rates.
There are two most important pathophysiological processes in sepsis: a strong systemic inflammatory reaction and a long-lasting systemic metabolic dysfunction that is characterized by hypermetabolism and hypercatabolism and rapidly growing protein-energy malnutrition. Therefore it is crucial to prescribe optimal nutritional-metabolic support for this group of patients in order to reduce the period of the hypermetabolic-hypercatabolic syndrome and minimize the incidence of complications and, as the result, to increase the effectiveness of treatment. It is important to determine the route of administration, the nature and amount of nutritional substrate according to the intensity and prevalence of organ failure, to the level of consciousness, to the dysphagia, to the baseline nutritional status and to the absorption and digestion disorders [1–19].
The management and the amount of substrates needed for this type of patients, especially during the first week of their disease, are still under discussion [20].
Objective: to search the severity of metabolic dysfunction among septic patients and to define the criteria for optimal substrate supply for this category of patients.
The objectives of the study:
To solve the mentioned problems, we conducted a retrospective study of 166 septic patients treated in the intensive care unit (ICU) of the Saint-Petersburg I.I. Dzhanelidze Research Institute of Emergency Care from October 2016 to June 2020.
Patients with sepsis, both male and female, aged from 18 to 80, who required nutritional support (enteral, parenteral, or both) were included in the study. The exclusion criteria were established as follows: the period of nutritional support less than 10 days; extensive combined cytoreductive surgery for grade IV tumors; serious comorbidities in decompensation (chronic cardiovascular insufficiency, chronic kidney disease, liver cirrhosis); community-acquired infections (tuberculosis, acquired immunodeficiency syndrome); patients > 80 years of age.
The statistical analysis of the collected data was conducted using the criteria of Kolmogorov—Smirnov. We used the Student's t-test to confirm the normal distribution and to assess the statistical significance of the average samples. When there were no signs of normal distribution, we used the chi-square criterion. We used the Fisher's exact test to compare relative indexes. The 95 % probability level was accepted as the critical p-level (p = 0.05).
The distribution of patients by gender, age and body mass index (BMI) is shown in Table 1.
Table 1. Characteristics of patients (n) by gender, age and body mass index
| Gender | n (%) | Average age, years | Average BMI, kg/m2 |
|---|---|---|---|
| Female | 60 (36.1) | 56.1 ± 18.8 | 23.75 ± 4.0 |
| Male | 106 (63.9) | 51.0 ± 15.7 | 23.60 ± 3.7 |
| 166 (100) | 52.8 ± 17.0 | 23.63 ± 3.8 |
There was no significant age or BMI difference between men and women.
Some laboratory test values at the admission to the ICU are represented in Table 2.
Table 2. Laboratory parameters of patients at the time of admission to the ICU
| Average value at admission | Normal range | Value (M ± m) |
|---|---|---|
| Haemoglobin, g/L | 130–160 | 93.4 ± 19.8 |
| Lymphocytes, ×109/L | 1.2–3 | 1.17 ± 0.6 |
| Leukocytes, ×109/L | 4–9 | 12.2 ± 6.3 |
| General protein, g/L | 64–83 | 49.6 ± 7.9 |
| Albumin, g/L | 35–55 | 21.85 ± 4.4 |
| Urea, mmole/L | < 8.3 | 12.25 ± 6.3 |
| Creatinine, micromole/L | 60–120 | 118 ± 45.6 |
| Glucose, mmole/L | 3.05–6.38 | 8.5 ± 3.7 |
| Cholinesterase, unit/L | 6400–15 500 | 2311 ± 972 |
| C-reactive protein, mg/L | < 5 | 165.7 ± 131 |
The majority of patients developed hypoalbuminemia (100 %), leukocytosis (96.9 %), hypoproteinemia (96.4 %), anemia (90.3 %). Less often septic patients developed hyperglycemia (57.8 %), lymphopenia (55.4 %), uremia (46.9 %), leukocytopenia (2.4 %). All patients had high levels of C-reactive protein and low levels of cholinesterase, which is an indirect marker of the synthetic ability of the liver.
It is worth mentioning, that the hypoalbuminemia level, usually associated with the severity of sepsis, turned out to be a predictor of the disease outcome. A significantly lower mortality (р< 0.01) was in the group of patients whose albumin level was 25 g/L and more (7.1 %). When the albumin level was between 20–25 g/L, the mortality rate raised up to 38.2 %, and up to 43.1 % — when the albumin level decreased < 20 g/L.
The severity of organ dysfunction was assessed at the admission to the ICU with the Sequential Organ Failure Assessment (SOFA) scale: 4.44 ± 2.4 scores (43.4 % of patients had less than 4 scores, 17.9 % — 5–6 scores and 38.8 % — had over 6 scores). The patients’ average level of consciousness, assessed by Glasgow Coma Scale was 11.7 ± 3.1 days. The average length of stay in the ICU was 25.4 ± 11 days and the average duration of mechanical ventilation (ALV) — 17.5 ± 16.1 days.
The distribution of patients by type of sepsis and mortality is shown in Table 3.
Table 3. Distribution of patients (n) by type of sepsis and mortality
| Type of sepsis | n (%) | Mortality, % |
|---|---|---|
| Abdominal | 85 (51.2) | 34.1 |
| Pulmonary | 51 (30.8) | 47.1 |
| Soft-tissue infection | 15 (9.0) | 40.0 |
| Sepsis-associated encephalopathy | 15 (9.0) | 40.0 |
The data represented in Table 3 show that the majority of patients developed the abdominal type of sepsis (51.2 % of all cases), which is associated with the lowest mortality rate. The overall mortality rate in the study was 39.16 % (40.0 % — male and 38.7 % — female). The patients who died were significantly older than those who survived (Table 4).
Table 4. Mortality of patients (n) depending on age
| Outcome | n | Mortality, % | Age, years |
|---|---|---|---|
| Recovery | 101 | 39.16 | 49.7 ± 17.7* |
| Death | 65 | 57.3 ± 15.1 | |
| Total | 166 | 52.8 ± 17.0 | |
| * The difference between the compared parameters in groups are statistically significant (р < 0.01). | |||
It is also worth mentioning, that the highest mortality rate was in the group of patients who suffered from energy-protein malnutrition (42.5 %) and from marasmic kwashiorkor (35.5 %) at baseline, and the lowest mortality was in the group of patients with nutritional marasmus (20 %).
Management goals for nutrition in sepsis were as follows: calories 20–25 kcal/kg/day, protein 1–1.2 g/kg/day — in case the condition of the patient was unstable; and calories 25–35 kcal/kg/day, protein 1.3–2 g/kg/day for those, who were stable. The micronutrient supply was provided in the amount indicated by the daily deficiency needs. The total amount of nutritional support was gradually increased during 3–4 days (500 kcal/day and more) with the regular check up of the metabolic response. For patients with overweight and obesity the nutrition delivery doses are calculated regarding the ideal body weight, for undernourished and eutrophic patients — regarding the actual body weight.
The primary objective of the nutritional support of septic patients was early enteral nutrition that started in the first 24–48 hours upon admission to the ICU. If the nutrition goals could not be achieved enterally, additional parenteral nutrition was prescribed within 5 days. If it seemed to be impossible to feed the patient enterally in the first 5–7 days (it was typical for patients with abdominal sepsis), we began parenteral nutrition in the first 48–72 hours and gradually increased its volume keeping in check the rate of administration of nutritional substrates.
There were several contraindications for nutritional support: toxic shock syndrome, severe arterial hypoxemia (the oxygen partial pressure in arterial blood was less than 50 mm Hg), the decompensated hyperchloremic acidosis (hyperlactatemia 4 mmol/L and more), hypercapnia (the dioxide carbon partial pressure > 80 mm Hg, рН < 7.2), intolerance to feeding formulas.
The actual energy expenditure (AEE) was calculated by indirect calorimetry (metabolimeter Qvark-RMR produced by CosMed, Italy). The catabolic reaction and protein needs were assessed by calculating the daily nitrogen losses and the nitrogen balance.
The indirect calorimetry was carried out in the first 2–3 days, then on the 5–6, 10–11 and 15–16 days in the intensive care unit. The average level of basal metabolic rate (BMR) during the whole period of treatment in the ICU was 2226 ± 96 kcal/day or 30.9 ± 1.4 kcal/kg/day, average respiratory ratio rates — 0.69 ± 0.04, which is a sign of predominating lipid peroxidation.
Along with that, we measured daily nitrogen losses in the above time limits for all the patients without kidney or liver failure. Then we calculated the ratio between nitrogen losses in grams and the obtained AEE values in kilocalories, as well as the ratio between nitrogen losses and non-protein energy expenditure. The collected data were brought into correlation with the severity of organ dysfunction.
Dynamics of average energy expenditure and nitrogen losses is shown in Table 5.
Table 5. Dynamics of АЕE and nitrogen losses depending on the timing of sepsis
| Day of sepsis | n | SOFA, score | AEE, kcal/day | AEE, kcal/kg/day | Nitrogen losses, g/day | Nitrogen losses, g/kg/day |
|---|---|---|---|---|---|---|
| 2–3 | 166 | 4.33 ± 2.4 | 1930 ± 115 | 27.0 ± 2.1 | 20.6 ± 1.5 | 0.28 ± 0.01 |
| 5–6 | 158 | 3.89 ± 2.3 | 2366 ± 126 | 33.5 ± 1.8 | 20.8 ± 1.4 | 0.32 ± 0.02 |
| 10–11 | 122 | 3.96 ± 2.8 | 2247 ± 175 | 29.9 ± 2.4 | 18.1 ± 1.3 | 0.25 ± 0.01 |
| 15–16 | 90 | 2.91 ± 1.8 | 2328 ± 411 | 30.3 ± 5.4 | 17.0 ± 1.2 | 0.24 ± 0.1 |
| AEE — actual energy expenditure; n — number of patients; SOFA — Sepsis-Related organ Failure Assessment score. | ||||||
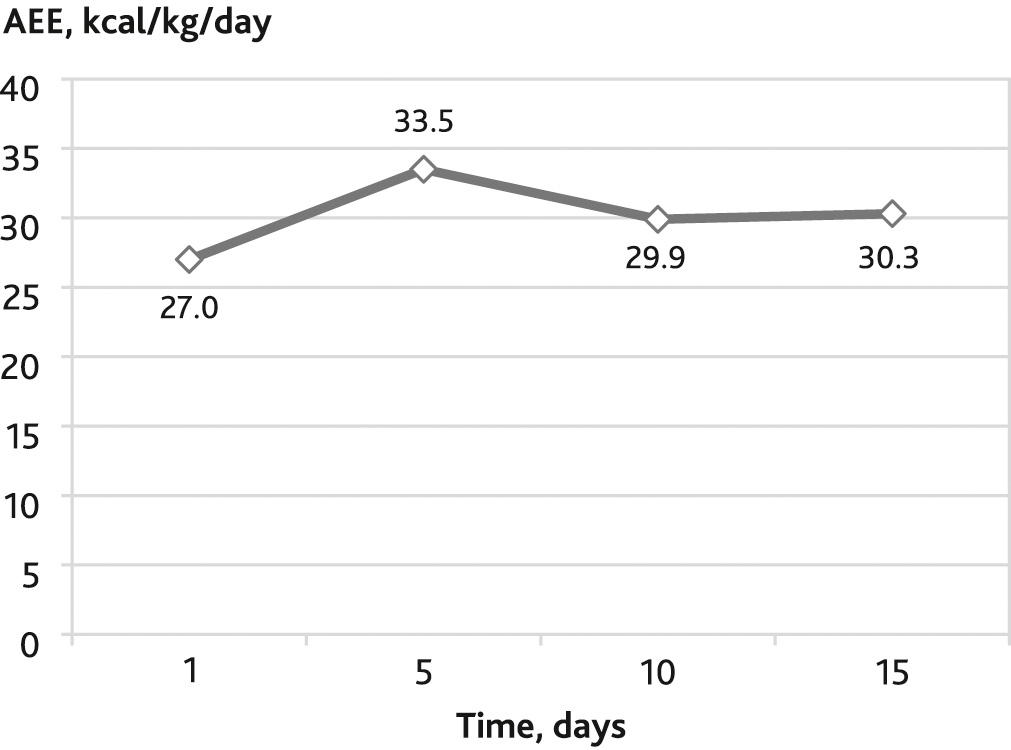
The average energy expenditure at the beginning of the septic process was 27.0 ± 2.1 kcal/kg/day, reached the peak on the 5–6 day (33.5 ± 1.8 kcal/kg/day) and then flattened out at 30.0 ± 3.6 kcal/kg/day (Fig. 1).
Fig. 1. Dynamics of the actual energy expenditure (АEE) depending on the timing of the development of sepsis
The average day nitrogen loss during the whole research period was 18.8 ± 0.6 g/day (0.27 ± 0.01 g/kg/day), 1.68 ± 0.06 g/kg/day of protein. respectively. The protein loss reached its maximum on the 5th day of the disease (1.93 ± 0.12 g/kg/day) and later stood at 1.56 ± 0.13 g/kg/day.
The association between average energy expenditure, nitrogen losses, the ratio of lost nitrogen to total and non-protein energy expenditure (NР kcal) depending on the severity of organ dysfunction, are displayed in Table 6.
Table 6. Average energy expenditure (AEE), nitrogen losses, the ratio of lost nitrogen to total and non-protein energy expenditure (NР kcal) depending on the severity of organ dysfunction
| SOFA, score | Average SOFA | AEE, kcal/day | AEE, kcal/kg/day | Nitrogen losses, g/day | NP kcal | Nitrogen, g: AEE, kcal | Nitrogen, g: NP kcal |
|---|---|---|---|---|---|---|---|
| 4 and more | 5.9 ± 0.17* | 2159 ± 165 | 28.8 ± 1.7 | 21.1 ± 1.3 | 1691 ± 159 | 1:109 | 1:85 |
| 1–3 | 2.2 ± 0.06* | 2171 ± 134 | 29.8 ± 1.9 | 16.8 ± 0.8 | 1723 ± 138 | 1:143 | 1:104 |
| * The differences of the parameters, compared in the groups, are significant (р < 0.05). | |||||||
We divided septic patients into three groups to assess the effects of different types of energy supply. The first group was supplied with 25 kcal/kg/day, the second group — 25–30 kcal/kg/day, and the third — > 30 kcal/kg/day. We divided patients into groups retrospectively, considering the average daily level of energy supply during the whole period of treatment (Table 7). There were no significant differences in the severity of organ dysfunction (measured with the SOFA scale) between groups.
Table 7. Mortality in severe sepsis depending on the average daily level of energy supply (ES) (n = 166)
| ES, kcal/kg/day | Outcome | n | Mortality, % | Average ES, kcal/kg/day |
|---|---|---|---|---|
| < 25 | discharge | 49 | 46* | 20.2 ± 0.5 |
| death | 43 | 20.2 ± 0.5 | ||
| 25–30 | discharge | 39 | 31# | 27.0 ± 0.2 |
| death | 18 | 27.2 ± 0.3 | ||
| > 30 | discharge | 13 | 23# | 33.5 ± 0.9 |
| death | 4 | 31.2 ± 0.9 | ||
| n — number of patients. * The differences in comparison with all groups are significant (р < 0.05). # The differences in comparison with the first group are significant (р < 0.05). |
||||
As shown in Table 7, the lowest mortality was in the group of patients who received > 30 kcal/kg/day. It was decreased by 50 % in comparison with the patients who received < 25 kcal/kg/day. Among patients who received 25–30 kcal/kg/day mortality was also significantly lower (1.5 times) than in the first group (< 25 kcal/kg/day), but 1.4 times higher than in the third group of patients (> 30 kcal/kg/day). However, there was no statistically significant difference between the 2nd and the 3rd group.
Patients in the study were also divided into groups (Table 8) according to the amount of protein that they received. There were no significant differences in the severity of organ dysfunction (measured with the SOFA scale) between groups.
Table 8. Outcomes of severe sepsis depending on the average daily protein supply (PS) (n = 166)
| PS, g/kg/ day | Outcome | n | Mortality, % | Average PS, g/kg/day |
|---|---|---|---|---|
| < 1.2 | discharge | 42 | 46.2# | 1.01 ± 0.02 |
| death | 36 | 0.98 ± 0.02 | ||
| 1.2–1.5 | discharge | 38 | 39.7# | 1.33 ± 0.01 |
| death | 25 | 1.36 ± 0.02 | ||
| > 1.5 | discharge | 21 | 16.0* | 1.63 ± 0.02 |
| death | 4 | 1.73 ± 0.09 | ||
| n — number of patients. # The differences in comparison with the last group are significant (р < 0.05). * The differences in comparison with all groups are significant (р < 0.05). |
||||
The data in Table 8 show the statistically significant lowest mortality rate between patients who received more than 1.5 g/kg/day of protein. The mortality rate in this group was by 2.9 lower, than in the group with protein supply < 1.2 g/kg/day and by 2.5 lower than in the group with 1.2–1.5 g/kg/day. There was no statistically significant difference in mortality between the 1st and the 2nd groups.
The nitrogen balance was significantly different (to a better extent) in the group of patients who received a high amount of protein (more than 1.5 g/kg/day) during the whole study. The ratio between patients with positive nitrogen balance and the total amount of examined patients different stages of sepsis with different protein supply is shown in Table 9.
Table 9. Positive nitrogen balance at different stages of sepsis with different protein supply
| Protein supply, g/kg/day | Positive nitrogen balance, % from all the examinated patients | ||
|---|---|---|---|
| 5–6 day | 10–11 day | 15–16 day | |
| < 1.2 | 18.7 | 11.1# | 37.5# |
| 1.2–1.5 | 13.0 | 18.7# | 33.3# |
| > 1.5 | 20.0 | 46.1* | 72.7* |
| # The differences in comparison with the last group are significant (р < 0.05). * The differences in comparison with all groups are significant (р < 0.05). |
|||
When protein supply was in the amount more than 1.5 g/kg/day, almost half of the patients reached positive values of nitrogen balance on day 10–11, and 73 % of patients on day 15–16, (significantly faster, than patients who received less protein supply).
Relationship between mortality and nitrogen balance at different stages of sepsis development is displayed in Table 10.
Table 10. Relationship between mortality and nitrogen balance at different stages of sepsis development
| Nitrogen balance | 5–6 day of sepsis | 10–11 day of sepsis | ||
|---|---|---|---|---|
| n | Mortality, % | n | Mortality, % | |
| Negative | 108 | 38.9* | 69 | 44.9* |
| Positive | 16 | 18.7* | 30 | 30* |
| n — number of patients. * The differences in comparison with a corresponding group are significant (р < 0.05). |
||||
The data in Table 10 show, that if positive nitrogen balance is achieved at any stage of the development of sepsis, then mortality significantly decreases.
The route, type and amount of nutritional support for septic patients, especially during the first week upon admission to hospital, are still under discussion [20]. The international guidelines for management in severe sepsis and septic shock (published in 2012) [21] are based on the results of three randomized studies [22–24], where there were no significant differences in mortality rates between trophic (400–500 kcal/day) and full-energy (1300–1500 kcal/day) enteral nutrition within the first week of the disease. Thus, it is recommended to choose the strategy of initial trophic enteral feeding [25]. This statement is contrary to Canadian guidelines published in 2013 [26] and the results of the analysis of a large nutrition database, carried out by Elke G [27, 28]. The analysis included pooled data collected prospectively from international nutrition studies (13,630 patients in 730 ICU in 33 countries included in the dataset, 2270 patients met the study inclusion criteria). Mechanically ventilated patients received a mean amount of 1057 kcal/day (14.5 kcal/kg/day) and 49 g protein/day (0.7 g/kg/day) by enteral nutrition in the first week. An increase of 1000 kcal was associated with reduced 60-day mortality and more ventilaton-free days, as was an increase of 30 g protein per day.
Our data show that the energy expenditure of septic patients reach the maximum on the 5–6 day of the disease (33.5 ± 1.8 kcal/kg/day or 2366 ± 126 kcal/day in absolute data values). Mean energy expenditure values are around 2226 ± 96 kcal/day or 30.9 ± 1.4 kcal/kg/day. If the amount of energy nutrition provided to these patients in the ICU is less than 25 kcal/kg/day, the mortality rate significantly increases. Reaching optimal energy targets (30 kcal/kg/day and more) is associated with a decrease in mortality by 50 %.
Optimal protein support of critically ill patients remains a question for further discussion. There is a number of recent studies showing that nourishing a patient with high quantities of nitrogen shortens the period of mechanical ventilation, decreases the number of infectious complications, reduces the length of stay in the ICU and mortality [27, 29–32].
For example, the results of a randomized study, conducted in 2016 by S. Ferrie et al. show that higher protein provision for critically ill patients (> 1.2 g/kg/day compared with < 0.8 g/kg/day) is associated with positive changes of somatometric parameters. At the same time there was no difference in mortality and length of stay in the ICU [33]. The authors of the other study proved that skeletal muscle wasting occurs early and rapidly in critical illness and is not associated with nutrition support [34]. According to the results of M.P. Casaer et al., a higher dose of calories and protein administered parenterally in the first week and combined with low-energy enteral nutrition is associated with more intensive muscle wasting and more delayed recovery [35]. The group of patients with early combined (enteral-parenteral) feeding received 1576 ± 368 kcal/day and 47.2 ± 15.1 g protein/day from the 3rd to the 7th day after admission, and the group with low-energy enteral nutrition received 594 ± 345 kcal/day and 14.2 ± 14.6 g protein/day. At the end of the first week the amount of nutrition support became equal in both groups.
In the next multicenter study data were collected from 2772 patients on mechanical ventilation in 167 ICUs from 37 countries. It was shown that the provision of higher calories (> 1500 kcal/day) and protein (> 60 g/day) was associated with a significant overall reduction in 60-day mortality. The largest mortality reduction was obtained at 1900 kcal/day and 90 g protein/day [29].
M.J. Allingstrup et al. [36] conducted a prospective observational cohort study of 113 ICU patients, mainly (88.5 %) septic. They registered the lowest mortality rate (16 %) when protein supply reached 1.46 ± 0.29 g/kg/day. In the groups of patients with protein supply 0.79 ± 0.29 and 1.06 ± 0.23 g/kg/day, mortality rate was 27 % and 24 % correspondingly. At the same time, there was no association found between higher provision of energy and the disease outcome.
Our findings demonstrate that in septic patients protein losses measured with daily nitrogen losses achieve the highest values (1.93 ± 0.12 g/kg/day) on the 5–6th day of the disease. Mean protein losses in septic patients are around 1.68 ± 0.06 g/kg/day. Supplying these patients with > 1.5 g/kg/day of protein results in a significant reduction of mortality rate, compared to patients who receive less protein per day.
Our findings show that it is reasonable to use a personalized approach when choosing the strategy of energy and protein supply of septic patients. It is necessary to consider the severity of organ dysfunction (assessing it with the SOFA scale). With equal energy expenditure values, when SOFA scores are 1–3 and 4 and more (29.8 ± 1.9 and 28.8 ± 1.7 kcal/kg/day correspondingly), because of the growing nitrogen losses and the aggravation of organ dysfunction, the balance between nitrogen and non-protein kilocalories changes (1:104 when SOFA scores are 1–3, and 1:85 when SOFA scores are 4 and more). It is advisable to consider these differences during nutrition support of septic patients in order to optimize the energy and protein supply.
The hypermetabolism-hypercatabolism in septic patients is the most intensive on the 5th day:
Disclosure. The authors declare that they have no competing interests.
Author contribution. All authors according to the ICMJE criteria participated in the development of the concept of the article, obtaining and analyzing factual data, writing and editing the text of the article, checking and approving the text of the article.
Ethics approval. This study was approved by the local Ethical Committee of I.I. Dzhanelidze Research Institute of Emergency Care (reference number: 3-29.03.2022).