Cerebral stroke in general and acute ischemic stroke (AIS) in particular continues to be a significant medical problem, being the 3rd most common cause of death in the world and in 20 % of cases accompanied by persistent disability [1]. Severe AIS in its clinical course is accompanied by life-threatening disorders of the functions of organ systems, primarily the central nervous system. Clinical manifestations of central nervous system dysfunction are identified as the acute cerebral insufficiency. Cerebral insufficiency and severe neurological deficit trigger the dysfunction of other organ systems as a result of an impairment of the central nervous system regulatory functions and extracerebral complications [2–4]. Also the organ dysfunctions in AIS is likely to be caused by “cerebrovisceral interactions” or syndromes [4, 5]. An iatrogenic factor in the development of organ dysfunctions cannot be excluded.
The most frequent manifestation of extracerebral organ dysfunction in severe AIS is acute respiratory failure [2, 7, 8]. Frequently, these patients in the acute period require respiratory support in the form of oxygen therapy, in a significant proportion of cases tracheal intubation, mechanical ventilation and further tracheostomy are required [7]. The development of cardiovascular dysfunction [9, 10], acute kidney injury [11, 12], acute liver failure and thrombocytopenia [2], protein-energy impairment [13] are also noticed. The dysfunction of two or more organ systems is defined as multiple organ failure (MOF) [14], the progression of which significantly aggravates the clinical course and outcome. Intensive therapy should be aimed at preventing the development and progression of MOF, as well as at the fastest possible relief of its manifestations, which makes it relevant to predict the clinical course and outcomes in patients with severe AIS using mathematical modeling methods [3]. It is also worth noting that the question of the clinical course and outcomes features of AIS with MOF at various localizations and pathogenetic subtypes is not sufficiently disclosed.
Objectives. The objective of the work is to study the prognostic aspects of the outcomes of severe AIS with the development of MOF.
A retrospective observational study included 110 patients with severe AIS, corresponding to the National Institutes of Health Stroke Scale (NIHSS) score ≥ 16 points, hospitalized within 24 hours of the onset of the disease. Patients were hospitalized in intensive care units for patients with stroke of “N.I. Pirogov State Clinical Hospital” of Orenburg and “Orenburg Regional Clinical Hospital” in the period 2017–2020. Inclusion criteria were the ischemic stroke, age from 18 to 85 years, development of more than one dysfunction of organs and systems. Non-inclusion criteria were pregnancy, histologically confirmed malignant tumors, cardiovascular diseases (grades 3–4 according to NYHA), cirrhosis of the liver (terminal), chronic kidney disease of the 5th stage. Diagnosis and treatment were carried out in accordance with clinical recommendations and the procedure for providing medical care to patients with acute stroke. To determine the pathogenetic subtype of AIS, the criteria of Trial of Org 10172 in Acute Stroke Treatment (TOAST) were applied. Generally accepted clinical and instrumental laboratory criteria were evaluated to determine organ failure. Standard scales Simplified Acute Physiology Score II (SAPS II), Sequential Organ Failure Assessment (SOFA) were used for the general assessment of the MOF severity. The assessment was carried out on the 1st and 5th days of hospitalization. The outcome of the disease was assessed on the 28th day from the beginning of AIS.
Quantitative data were presented in the form of median (Me), upper and lower quartiles (Q1; Q3), qualitative — in the form of absolute quantity (n) and percentages (%). The nonparametric Mann-Whitney criterion was used to assess the reliability of the difference in quantitative indicators, and the Pearson's χ2 test was used for qualitative indicators. A comparative regression analysis using of the least squares method was performed to determine the predictor significance of the indicators, and the coefficient of determination (R2) was determined for the obtained regression models. The level p < 0.05 was taken as significant. The Statistica-10.0 program (StatSoft, USA) was used for data processing.
The study was approved by the local Ethics Committee of the Orenburg State Medical University of the Ministry of Health of the Russian Federation, Protocol No. 258 of 09.10.2020.
The characteristics of the observed patients are presented in Table 1. 90 patients were diagnosed with AIS in the carotid territory, 20 — in the vertebrobasilar circulation. Patients with different localization were comparable in gender, age, NIHSS and SAPS II assessment on admission. The atherothrombotic subtype prevailed among patients with AIS in the vertebrobasilar system, as cardioembolism prevailed in carotid system AIS. 28-day mortality was 60.91 %, there were not statistically significant differences in the frequency of death in patients with different localization of AIS (p = 0.3570).
Table 1. Comparative characteristics of the patients with severe ischemic stroke in groups with different localization
| Sign | Total | Vertebrobasilar system | Carotid system | p |
|---|---|---|---|---|
| Quantity, n (%) | 110 (100) | 20 (18.18) | 90 (81.82) | – |
| Age, years, Me (Q1; Q3) | 75 (67; 79) | 71 (65.5; 79) | 75.5 (68; 80) | 0.3016 |
| Male, n (%) | 50 (45.45) | 10 (50) | 40 (44.44) | 0.6517 |
| Female, n (%) | 60 (54.55) | 10 (50) | 60 (55.56) | |
| Primary, n (%) | 61 (55.45) | 6 (30) | 55 (61.11) | 0.0113* |
| Recurrent, n (%) | 49 (44.54) | 14 (70) | 35 (38.89) | |
| Atherothrombotic subtype, n (%) | 41 (37.27) | 16 (80) | 25 (27.78) | < 0.0001* |
| Cardioembolic subtype, n (%) | 49 (44.54) | 4 (20) | 45 (50) | |
| Indeterminate subtype, n (%) | 20 (18.18) | 0 (0) | 20 (22.22) | |
| NIHSS on admission, points, Me (Q1; Q3) | 19 (17; 21) | 19.5 (17.5; 24) | 19 (17; 21) | 0.2527 |
| SAPS II on the 1st day, points, Me (Q1; Q3) | 29 (23; 33) | 32 (23.5; 45) | 28 (23; 32) | 0.0519 |
| Survivors, n (%) | 43 (39.09) | 6 (30) | 37 (41.11) | 0.3570 |
| Lethal, n (%) | 67 (60.91) | 14 (70) | 53 (58.89) | |
| Data are presented as Me (Q1; Q3) (quantitative) and n (%) (qualitative). The level of significance of statistical differences (p-value) between groups was assessed with the Mann-Whitney U-test (quantitative data) and Pearson's χ2 test (qualitative data). *Significant level of statistical differences p < 0.05. NIHSS — National Institutes of Health Stroke Scale; SAPS II — Simplified Acute Physiology Score II. |
||||
The groups of patients with different outcomes weren’t distinguished by age and gender (Table 2). In the group of surviving patients, primary AIS prevailed (65.12 %), while among lethal patients primary AIS was 49.25 %, the differences were statistically insignificant. In the study group, the frequency of the cardioembolic subtype was higher than the atherothrombotic subtype (44.54 % and 37.27 %, respectively). The indeterminate subtype was observed with a lower frequency (18.18 %). At the same time, among the surviving patients (48.84 %) the atherothrombotic subtype prevailed, in patients with fatal outcome cardioembolic AIS (50.75 %) prevailed. The differences between these subtypes were statistically significant (p = 0.0469). The NIHSS score on the first day in the study group was 19 (17; 21) points, while in the group of surviving patients it was slightly less than in the fatal group — 18 (17; 21) and 19 (17; 22) points respectively. However, the differences were statistically insignificant. Scores on the SAPS II and SOFA scales were higher in patients with a fatal outcome on days 1 and 5 (p < 0.0001).
Table 2. Comparative characteristics of the patients with severe ischemic stroke in groups with different outcomes
| Total | Survivors | Lethal | p | |
|---|---|---|---|---|
| Number of observations, n (%) | 110 (100) | 43 (39.09) | 67 (60.91) | – |
| Age, years, Me (Q1; Q3) | 75 (67; 79) | 75 (67; 80) | 75 (67; 79) | 0.8952 |
| Male, n (%) | 50 (45.45) | 19 (44.19) | 30 (45.78) | 0.9515 |
| Female, n (%) | 60 (54.55) | 24 (55.81) | 37 (55.22) | |
| Primary, n (%) | 61 (55.45) | 28 (65.12) | 33 (49.25) | 0.1024 |
| Repeated, n (%) | 49 (44.54) | 15 (34.88) | 34 (50.75) | |
| Atherothrombotic subtype, n (%) | 41 (37.27) | 21 (48.84) | 20 (29.85) | 0.0469* |
| Cardioembolic subtype, n (%) | 49 (44.54) | 15 (34.88) | 34 (50.75) | |
| Indeterminate subtype, n (%) | 20 (18.18) | 7 (16.28) | 13 (19.4) | – |
| NIHSS on admission, points, Me (Q1; Q3) | 19 (17; 21) | 18 (17; 21) | 19 (17; 22) | 0.0751 |
| SAPS II, points, Me (Q1; Q3) | ||||
| 1st day | 29 (23; 33) | 24 (21; 29) | 31 (25; 39) | < 0.0001* |
| 5th day | 34 (28; 42) | 29 (25; 35) | 40 (33; 49.5) | < 0.0001* |
| SOFA, points, Me (Q1; Q3) | ||||
| 1st day | 2 (1; 3) | 2 (1; 3) | 3 (2; 5) | 0.0014* |
| 5th day | 2 (2; 5) | 2 (1; 3) | 3 (2; 6) | < 0.0001* |
| Data are presented as Me (Q1; Q3) (quantitative) and n (%) (qualitative). The level of significance of statistical differences (p-value) between groups was assessed with the Mann-Whitney U-test (quantitative data) and Pearson's χ2 test (qualitative data). *Significant level of statistical differences p < 0.05. NIHSS — National Institutes of Health Stroke Scale; SAPS II — Simplified Acute Physiology Score II. |
||||
A comparative analysis of the comorbid pathology of patients with severe AIS and different outcomes is presented in Table 3. There were no differences in the frequency of postinfarction cardiosclerosis, chronic heart failure, chronic kidney disease, type 2 diabetes mellitus and obesity.
Table 3. Comparative characteristics of comorbid pathology in patients with severe ischemic stroke in groups with different outcomes
| Total | Survivors | Lethal | p | |
|---|---|---|---|---|
| Number of observations, n (%) | 110 (100) | 43 (39.09) | 67 (60.91) | – |
| Postinfarction cardiosclerosis, n (%) | 30 (27.27) | 8 (18.60) | 22 (32.83) | 0.1020 |
| Chronic heart failure | ||||
| 1, n (%) | 20 (18.18) | 8 (18.60) | 12 (17.91) | 0.9954 |
| 2A, n (%) | 67 (60.91) | 26 (60.46) | 41 (61.19) | |
| 2B, n (%) | 23 (20.91) | 9 (20.93) | 14 (20.89) | |
| Chronic kidney disease | ||||
| C1, n (%) | 8 (7.27) | 5 (11.63) | 3 (4.48) | 0.4589 |
| C2, n (%) | 49 (44.54) | 21 (48.84) | 28 (41.79) | |
| C3A, n (%) | 30 (27.27) | 10 (23.26) | 20 (29.85) | |
| C3B, n (%) | 21 (19.09) | 6 (13.95) | 15 (22.39) | |
| C4, n (%) | 2 (1.81) | 1 (2.32) | 1 (1.49) | |
| Type 2 diabetes mellitus, n (%) | 30 (27.27) | 10 (23.26) | 20 (29.85) | 0.4485 |
| Body Mass Index | ||||
| < 30 kg/м2, n (%) | 65 (59.09) | 27 (62.79) | 38 (56.72) | 0.4481 |
| 30–34.9 kg/м2, n (%) | 27 (24.54) | 12 (27.91) | 15 (22.39) | |
| 35–39.9 kg/м2, n (%) | 13 (11.82) | 3 (6.98) | 10 (14.92) | |
| ≥ 40 kg/м2, n (%) | 5 (4.54) | 1 (2.33) | 4 (5.97) | |
| Data are presented as n (%). The level of significance of statistical differences (p-value) between groups was assessed using Pearson's χ2 test. | ||||
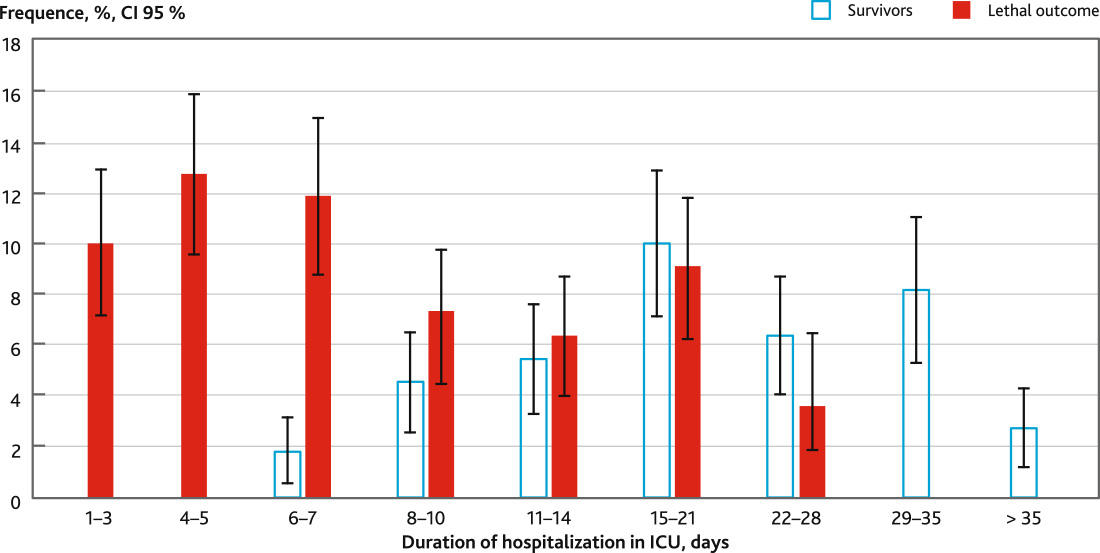
The duration of stay in the intensive care unit of patients with a fatal outcome was 7 (4; 12) days and of surviving patients — 20 (12; 31) days. The distribution of patients by the duration of stay in the intensive care unit is shown in Fig. 1. In the period from day 1 to day 5, a fatal outcome developed in 25 (22.7 %) patients. In 24 cases fatal outcomes developed against the background of rapid progression of acute cerebral insufficiency with the development of acute respiratory failure and acute cardiovascular dysfunction. In 1 patient with unexpressed MOF death was due to dislocation of the brainstem. In the period of 6–10 days, a fatal outcome was observed in 21 (19.09 %) patients, from 11 to 21 days — in 17 (15.45 %) patients, from 21 to 28 days — in 4 (3.64 %) patients.
Fig. 1. Distribution of patients with severe ischemic stroke with different outcomes according to the duration of hospitalization in ICU
A modeling of the probable mortality dependence on the severity of MOF assessment on the SAPS II on day 5 from the start of intensive therapy for various pathogenetic subtypes was performed.
In accordance with the mathematical features, the model of the dependence of the probable mortality of cardioembolic AIS on the severity of MOF determined by the SAPS II on the 5th day of intensive care has the following form:
\( y =\frac{e^{0,2358 \cdot x - 6,9853}}{1 + e ^ {0,2358 \cdot x - 6,9853}} \),
y — probable mortality (%), x — severity of MOF, expressed in points on the SAPS II, R2 = 0.9614.
The graph of this pattern can be divided into five fragments (Fig. 2).
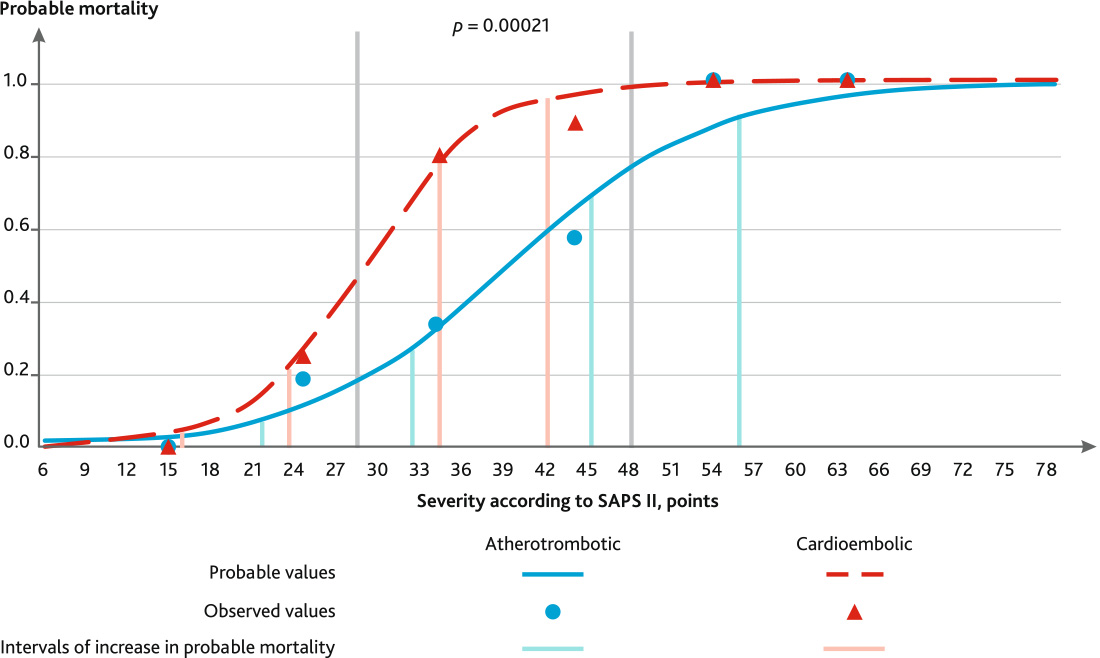
Fig. 2. Dependence of probable mortality on the severity of multiple organ failure according to the SAPS II scale on the 5th day in patients with severe ischemic stroke with various pathogenetic subtypes
Fragment No. 1 is the “lower plateau” is observed up to 16 points and corresponds to the mortality of moderate strokes with unexpressed MOF. The probable mortality in this group of patients will not exceed 3.87 %. The average rate of mortality increase in this fragment is 0.39 %/point.
The second fragment of the graph is the “lower bend”, characterized by increase in mortality. Patients in this group have cerebral insufficiency in the degree of superficial and deep stunning — Glasgow coma scale (GCS) 11–14, as well as initial manifestations of respiratory insufficiency (17–24 points). The probable mortality in this interval does not exceed 20.98 %. The average rate of mortality increase is 2.30 %/point.
The third fragment of the graph is a “rapid rise”, characterized by a sharp increase in mortality from 25.16 to 78.03 %. Patients in this group have cerebral insufficiency in the degree of deep stunning (GCS 11–12), as well as initial manifestations of parenchymal respiratory insufficiency, usually not requiring respiratory support (25–35 points). However, in this group there is a tendency to emerge MOF in the following days with the aggravation of cerebral and respiratory insufficiency, the addition of cardiovascular dysfunction. In our opinion, the severity of 35 points is a critical point where fundamental changes in the mortality prognosis begin. The average rate of mortality increase in this fragment is 5.29 %/point.
The fourth fragment, the “upper bend”, characterizes AIS with high mortality (81.81–95.91 %). The severity of stroke for this group of patients ranges from 36 to 43 SAPS II scores. The average rate of mortality increase in this fragment is 2.01 %/point. Patients of this group are mainly stuporous (GCS 9–10), suffer of parenchymal-ventilation respiratory dysfunction, requiring respiratory support. Systemic inflammatory reaction syndrome and signs of cardiovascular insufficiency are observed. Nevertheless, these patients have a high probability of further progression of MOF with the development of the unfavorable outcome.
The last fifth fragment, the “upper plateau”, characterizes a group of patients with AIS severity above 43 points and a probable mortality rate close to 100 %. In this group of patients, extensive MOF develops, represented by cerebral insufficiency to the degree of coma (GCS < 9), respiratory insufficiency with the need for respiratory support, in some cases vasopressor support is required. The clinical course in this group is unfavorable with a further increase in MOF, the development of central hyperthermia, electrolyte disorders.
The model of the dependence of the probable mortality of atherothrombotic stroke on the severity of multiple organ failure, determined by the SAPS II on the 5th day of the intensive care, has the following form:
\( y =\frac{e^{0,1390 \cdot x - 5,5898}}{1 + e ^ {0,1390 \cdot x - 5,5898}} \),
y — probable mortality (%), x — severity of MOF, expressed in points on the SAPS II, R2 = 0.9742.
The graph of this pattern also can be divided into five fragments (Fig. 2).
The first fragment of the “lower plateau” corresponds to an assessment on the SAPS II up to 22 points, the probable mortality in these patients reaches 7.37 %. The average rate of increase in probable mortality is 0.46 %/point. In this group, the phenomena of organ failure can be represented by cerebral insufficiency in the degree of superficial stunning (GCS 13–14).
The second fragment is the “lower bend”, for the atherothrombotic subtype corresponds to a range of 23–33 points, the probable mortality with this severity is 8.38–26.87 %, the average rate of increase in probable mortality is 1.85 %/ point. Patients in this group develop more pronounced cerebral insufficiency to the degree of deep stunning (GCS 11–12), there are initial manifestations of respiratory insufficiency in the form of dyspnea, signs of a systemic inflammatory reaction in the form of hyperthermia, leukocytosis are possible.
Fragment No. 3 — “rapid rise” — with the atherothrombotic subtype corresponds to an estimate of 34–46 points, while the probable mortality increases from 29.69 to 69.13 %. The average rate of increase in probable mortality is 3.28 %/point. In this group of patients, a clinic of MOF develops, cerebral insufficiency reaches the degree of deep stunning and stuporous, sometimes coma grade I (GCS 7–12). Respiratory insufficiency emerge mainly by parenchymal type following aspiration syndrome, severe tracheobronchitis and pneumonia, in some cases requiring invasive mechanical ventilation. There is an instability of hemodynamics in the form of tachycardia, arterial hypertension, but cardiovascular insufficiency with the need for vasopressor support is not observed in this group.
The fragment of the “upper bend” is characterized by a range on the SAPS II of 47–57 points, the probable mortality in this group is 72.02–91.18 %, the average rate of increase in probable mortality is 1.92 %/point. In patients of this group, cerebral insufficiency reaches the level from stuporous to coma grade II (GCS 5–10), most often coma grade I. There is respiratory insufficiency with the need for mechanical ventilation; respiratory insufficiency is more often by the ventilation type with a violation of the frequency and rhythm of breathing, in some cases respiratory insufficiency is mixed. Cardiovascular insufficiency develops with the need for vasopressor support with low and medium doses of vasopressors (for dopamine — less than 10 mkg/kg/min). The syndrome of systemic inflammatory reaction with febrile hyperthermia, leukocytosis is expressed. In some cases, electrolyte disorders are observed — hyper- and hypokalemia. Severe acute kidney injury was not recorded in these patients.
Fragment No. 5 — “upper plateau” — corresponds to an assessment above 57 points on the SAPS II with a level of probable mortality of 92.24–100 %. In patients of this group, the MOF is most pronounced, most patients are in a coma of II–III degree (GCS 3–6), invasive mechanical ventilation is performed for all, respiratory insufficiency of the ventilation-parenchymal type is observed. Most patients develop cardiovascular insufficiency with the need to support with medium and high doses of vasopressors, acute kidney injury with hypercreatininemia of more than 300 mkmol/l, oligo- and anuria is observed. Hypernatremia and central hyperthermia develop. In this group, severe cerebral complications like an edema and dislocation of the brain, occlusive hydrocephalus emerge develop causing an increase in the severity of MOF.
In order to analyze the dynamics of the obtained patterns, graphs of derivative functions were constructed (Fig. 3), having the form:
\( { y' =b_1 \times \frac{e^{b_1 x + b_2}}{1 + e^{b_1 x + b_2}} \times 1 - \frac{e^{b_1 x + b_2}}{1 + e^{b_1 x + b_2}}} \),
y′ — the value of the derivative corresponding to the rate of probable mortality change, x — the severity of MOF, rated on the SAPS II in points, b1 and b2 — coefficients obtained by the least squares method, e — the base of the natural logarithm.
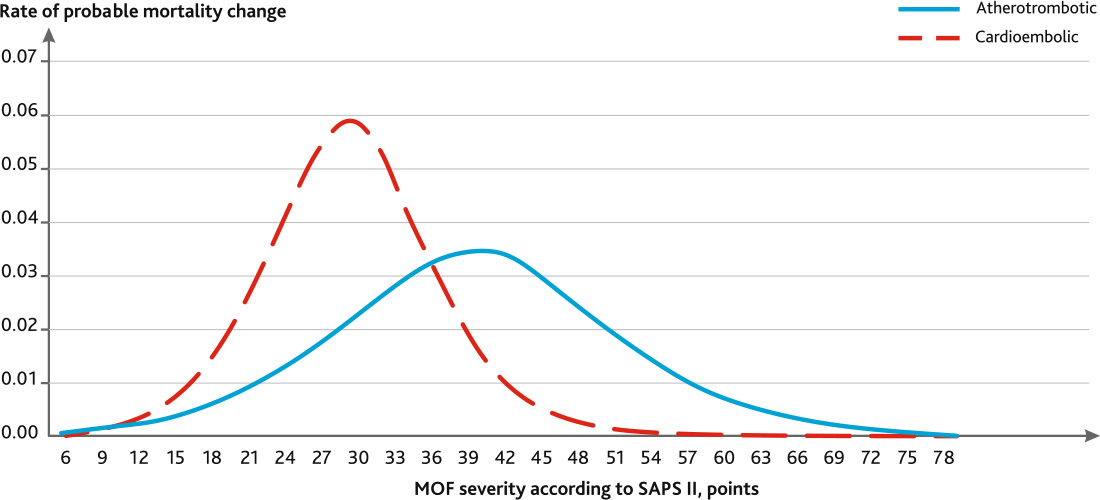
Fig. 3. Dependence of the rate of increase in probable mortality on the severity of multiple organ failure according to the SAPS II scale on day 5 in patients with severe ischemic stroke with various pathogenetic subtypes
It is known that the value of the derivative reflects the rate of function change at a given point. The maximum rate of probable mortality increase in the atherothrombotic subtype AIS is 0.0347, or 3.47 %/point, and is observed with a severity value on the SAPS II of 40 points. In the cardioembolic subtype AIS, the maximum growth rate is higher and amounts to 0.0588 (5.88 %/point), it has been already observed with 30 points SAPS II. With the severity of MOF on the SAPS II in the range 29–49 points, there are significant differences in the frequency of death in atherothrombotic and cardioembolic subtypes (p = 0.0021).
It is extremely important that in a wide range of MOF severity on day 5 of AIS (29–49 points) with comparable values on the SAPS II, the probable mortality on day 28 in the cardioembolic subtype of AIS was significantly higher in comparison with the atherothrombotic subtype mortality. These results are consistent with those obtained in the course of previous domestic and foreign studies [15–21]. In addition, the unfavorable prognostic significance of the cardioembolic subtype is confirmed [3, 22]. It should be noted that most of the works devoted to the prognostic value of organ dysfunction and MOF in severe stroke include the undifferentiated analysis of patients with ischemic and hemorrhagic lesion [11, 17–21]. The novelty of this study is to clarify the prognostic significance of MOF in assessing the outcome on day 28 in patients with severe AIS, as well as its definition and comparison in atherothrombotic and cardioembolic subtypes.
The understanding of the obtained regularities from the self-organizing systems theory point of view has been developed quite fully [3]. According to this theory, for severe AIS as a system, pathogenetic mechanisms of the AIS with MOF could be designated as control parameters. The impact of which one leads the system to the state of attractors — areas of the least and greatest mortality, in which the progression of AIS and the development of MOF is absent or reaches a maximum. These are zones of synergetic stability of the system with favorable and unfavorable forecasts. A distinctive feature of the attractor zone is the least influence of fluctuations, or external factors. In this case, external factors are intensive care measures aimed at relieving AIS pathogenetic mechanisms (cerebral edema, hypoxia, cardiovascular insufficiency, etc.). With an increase in the influence of control parameters (progression of acute cerebral insufficiency, extracerebral organ dysfunction), the sensitivity of the system decreases to the effects of external factors (intensive therapy). In order to optimize intensive care, it is necessary to identify areas of instability of the system in which the greatest rate of probable mortality increase is observed. Accordingly, it is necessary to consider the possibility of intensifying therapeutic measures at this moment — an earlier start of invasive respiratory support, strengthening osmotic therapy, antibiotic therapy. In this case, the areas of instability of the system (“rapid rise” and “upper bend”) are defined as the intervals of severity of MOF on the SAPS II from 34 to 57 points for the atherothrombotic subtype, from 25 to 43 points for cardioembolic subtype. The obtained results indicate an earlier increase in the severity of MOF with the need for maximum intensification of therapeutic and diagnostic measures in cardioembolic subtype of AIS.
Disclosure. The authors declare that they have no competing interests.
Author contribution. All authors according to the ICMJE criteria participated in the development of the concept of the article, obtaining and analyzing factual data, writing and editing the text of the article, checking and approving the text of the article.
Ethics approval. This study was approved by the local Ethical Committee of Orenburg State Medical University, Orenburg, Russia (reference number: 258-09.10.2020).
Funding source. This study was not supported by any external sources of funding.